
Advertisement
LaserBond (ASX:LBL) Has Rewarded Shareholders With An Exceptional 792% Total Return On Their Investment
Long term investing can be life changing when you buy and hold the truly great businesses. While not every stock performs well, when investors win, they can win big. For example, the LaserBond Limited (ASX:LBL) share price is up a whopping 660% in the last half decade, a handsome return for long term holders. This just goes to show the value creation that some businesses can achieve. It's also good to see the share price up 60% over the last quarter.
Anyone who held for that rewarding ride would probably be keen to talk about it.
Check out our latest analysis for LaserBond
There is no denying that markets are sometimes efficient, but prices do not always reflect underlying business performance. One flawed but reasonable way to assess how sentiment around a company has changed is to compare the earnings per share (EPS) with the share price.
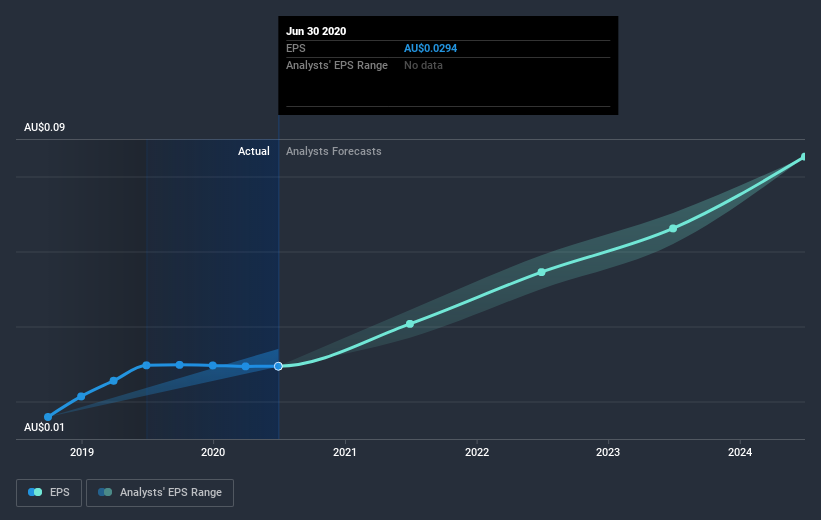
During five years of share price growth, LaserBond achieved compound earnings per share (EPS) growth of 48% per year. This EPS growth is remarkably close to the 50% average annual increase in the share price. That suggests that the market sentiment around the company hasn't changed much over that time. Indeed, it would appear the share price is reacting to the EPS.
You can see below how EPS has changed over time (discover the exact values by clicking on the image).
We know that LaserBond has improved its bottom line over the last three years, but what does the future have in store? If you are thinking of buying or selling LaserBond stock, you should check out this FREE detailed report on its balance sheet.
What About Dividends?
As well as measuring the share price return, investors should also consider the total shareholder return (TSR). The TSR incorporates the value of any spin-offs or discounted capital raisings, along with any dividends, based on the assumption that the dividends are reinvested. Arguably, the TSR gives a more comprehensive picture of the return generated by a stock. In the case of LaserBond, it has a TSR of 792% for the last 5 years. That exceeds its share price return that we previously mentioned. And there's no prize for guessing that the dividend payments largely explain the divergence!
A Different Perspective
It's nice to see that LaserBond shareholders have received a total shareholder return of 26% over the last year. And that does include the dividend. However, the TSR over five years, coming in at 55% per year, is even more impressive. Potential buyers might understandably feel they've missed the opportunity, but it's always possible business is still firing on all cylinders. It's always interesting to track share price performance over the longer term. But to understand LaserBond better, we need to consider many other factors. Case in point: We've spotted 3 warning signs for LaserBond you should be aware of.
If you are like me, then you will not want to miss this free list of growing companies that insiders are buying.
Please note, the market returns quoted in this article reflect the market weighted average returns of stocks that currently trade on AU exchanges.
If you decide to trade LaserBond, use the lowest-cost* platform that is rated #1 Overall by Barron’s, Interactive Brokers. Trade stocks, options, futures, forex, bonds and funds on 135 markets, all from a single integrated account. Promoted
New: AI Stock Screener & Alerts
Our new AI Stock Screener scans the market every day to uncover opportunities.
• Dividend Powerhouses (3%+ Yield)
• Undervalued Small Caps with Insider Buying
• High growth Tech and AI Companies
Or build your own from over 50 metrics.
This article by Simply Wall St is general in nature. It does not constitute a recommendation to buy or sell any stock, and does not take account of your objectives, or your financial situation. We aim to bring you long-term focused analysis driven by fundamental data. Note that our analysis may not factor in the latest price-sensitive company announcements or qualitative material. Simply Wall St has no position in any stocks mentioned.
*Interactive Brokers Rated Lowest Cost Broker by StockBrokers.com Annual Online Review 2020
Have feedback on this article? Concerned about the content? Get in touch with us directly. Alternatively, email editorial-team@simplywallst.com.
About ASX:LBL
LaserBond
A surface engineering company, engages in the development and application of materials, technologies, and methodologies to enhance operating performance and wear life of capital-intensive machinery components in Australia.
Flawless balance sheet with reasonable growth potential.
Market Insights

Advertisement
Community Narratives
The company that turned a verb into a global necessity and basically runs the modern internet, digital ads, smartphones, maps, and AI.
Fair Value US$300.00|7.1% undervalued
OS
Community Contributor
Flowers Foods Pays A Fair Price For Health
Fair Value US$16.12|26.4% undervalued
NV
Community Contributor
TMX Group will thrive with 33.3% profit margin and enduring market moat
Fair Value CA$49.90|0.8% overvalued
LI
Community Contributor
The "Molecular Pencil": Why Beam's Technology is Built to Win
Fair Value US$65.01|65.8% undervalued
DA
Community Contributor