Stock Analysis
- Australia
- /
- Construction
- /
- ASX:JLG
Will Weakness in Johns Lyng Group Limited's (ASX:JLG) Stock Prove Temporary Given Strong Fundamentals?


With its stock down 12% over the past three months, it is easy to disregard Johns Lyng Group (ASX:JLG). However, stock prices are usually driven by a company’s financial performance over the long term, which in this case looks quite promising. In this article, we decided to focus on Johns Lyng Group's ROE.
Return on Equity or ROE is a test of how effectively a company is growing its value and managing investors’ money. Put another way, it reveals the company's success at turning shareholder investments into profits.
View our latest analysis for Johns Lyng Group
How To Calculate Return On Equity?
The formula for ROE is:
Return on Equity = Net Profit (from continuing operations) ÷ Shareholders' Equity
So, based on the above formula, the ROE for Johns Lyng Group is:
13% = AU$60m ÷ AU$460m (Based on the trailing twelve months to December 2023).
The 'return' is the profit over the last twelve months. So, this means that for every A$1 of its shareholder's investments, the company generates a profit of A$0.13.
Why Is ROE Important For Earnings Growth?
Thus far, we have learned that ROE measures how efficiently a company is generating its profits. Depending on how much of these profits the company reinvests or "retains", and how effectively it does so, we are then able to assess a company’s earnings growth potential. Assuming all else is equal, companies that have both a higher return on equity and higher profit retention are usually the ones that have a higher growth rate when compared to companies that don't have the same features.
Johns Lyng Group's Earnings Growth And 13% ROE
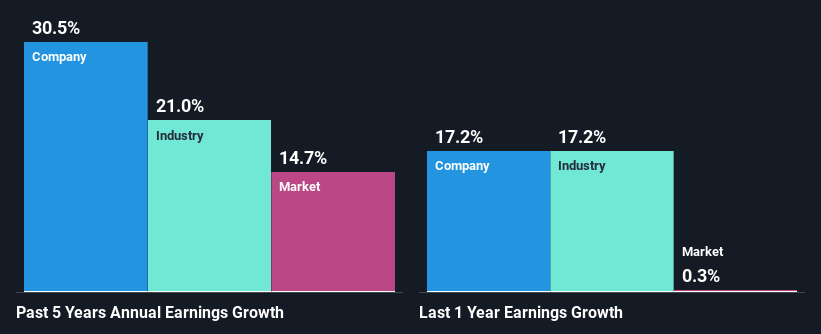
At first glance, Johns Lyng Group seems to have a decent ROE. Even when compared to the industry average of 13% the company's ROE looks quite decent. This probably goes some way in explaining Johns Lyng Group's significant 31% net income growth over the past five years amongst other factors. We believe that there might also be other aspects that are positively influencing the company's earnings growth. For example, it is possible that the company's management has made some good strategic decisions, or that the company has a low payout ratio.
As a next step, we compared Johns Lyng Group's net income growth with the industry, and pleasingly, we found that the growth seen by the company is higher than the average industry growth of 21%.
The basis for attaching value to a company is, to a great extent, tied to its earnings growth. It’s important for an investor to know whether the market has priced in the company's expected earnings growth (or decline). This then helps them determine if the stock is placed for a bright or bleak future. Is Johns Lyng Group fairly valued compared to other companies? These 3 valuation measures might help you decide.
Is Johns Lyng Group Efficiently Re-investing Its Profits?
The high three-year median payout ratio of 56% (implying that it keeps only 44% of profits) for Johns Lyng Group suggests that the company's growth wasn't really hampered despite it returning most of the earnings to its shareholders.
Moreover, Johns Lyng Group is determined to keep sharing its profits with shareholders which we infer from its long history of six years of paying a dividend. Upon studying the latest analysts' consensus data, we found that the company is expected to keep paying out approximately 47% of its profits over the next three years. Accordingly, forecasts suggest that Johns Lyng Group's future ROE will be 14% which is again, similar to the current ROE.
Conclusion
In total, we are pretty happy with Johns Lyng Group's performance. In particular, its high ROE is quite noteworthy and also the probable explanation behind its considerable earnings growth. Yet, the company is retaining a small portion of its profits. Which means that the company has been able to grow its earnings in spite of it, so that's not too bad. Having said that, the company's earnings growth is expected to slow down, as forecasted in the current analyst estimates. To know more about the latest analysts predictions for the company, check out this visualization of analyst forecasts for the company.
Valuation is complex, but we're helping make it simple.
Find out whether Johns Lyng Group is potentially over or undervalued by checking out our comprehensive analysis, which includes fair value estimates, risks and warnings, dividends, insider transactions and financial health.
View the Free AnalysisHave feedback on this article? Concerned about the content? Get in touch with us directly. Alternatively, email editorial-team (at) simplywallst.com.
This article by Simply Wall St is general in nature. We provide commentary based on historical data and analyst forecasts only using an unbiased methodology and our articles are not intended to be financial advice. It does not constitute a recommendation to buy or sell any stock, and does not take account of your objectives, or your financial situation. We aim to bring you long-term focused analysis driven by fundamental data. Note that our analysis may not factor in the latest price-sensitive company announcements or qualitative material. Simply Wall St has no position in any stocks mentioned.
Valuation is complex, but we're helping make it simple.
Find out whether Johns Lyng Group is potentially over or undervalued by checking out our comprehensive analysis, which includes fair value estimates, risks and warnings, dividends, insider transactions and financial health.
View the Free AnalysisHave feedback on this article? Concerned about the content? Get in touch with us directly. Alternatively, email editorial-team@simplywallst.com
About ASX:JLG
Johns Lyng Group
Provides integrated building services in Australia, New Zealand, and the United States.
Excellent balance sheet with proven track record.
