
Advertisement
Legendary fund manager Li Lu (who Charlie Munger backed) once said, 'The biggest investment risk is not the volatility of prices, but whether you will suffer a permanent loss of capital.' When we think about how risky a company is, we always like to look at its use of debt, since debt overload can lead to ruin. We note that Johns Lyng Group Limited (ASX:JLG) does have debt on its balance sheet. But should shareholders be worried about its use of debt?
What Risk Does Debt Bring?
Debt assists a business until the business has trouble paying it off, either with new capital or with free cash flow. If things get really bad, the lenders can take control of the business. While that is not too common, we often do see indebted companies permanently diluting shareholders because lenders force them to raise capital at a distressed price. Of course, plenty of companies use debt to fund growth, without any negative consequences. The first thing to do when considering how much debt a business uses is to look at its cash and debt together.
Check out our latest analysis for Johns Lyng Group
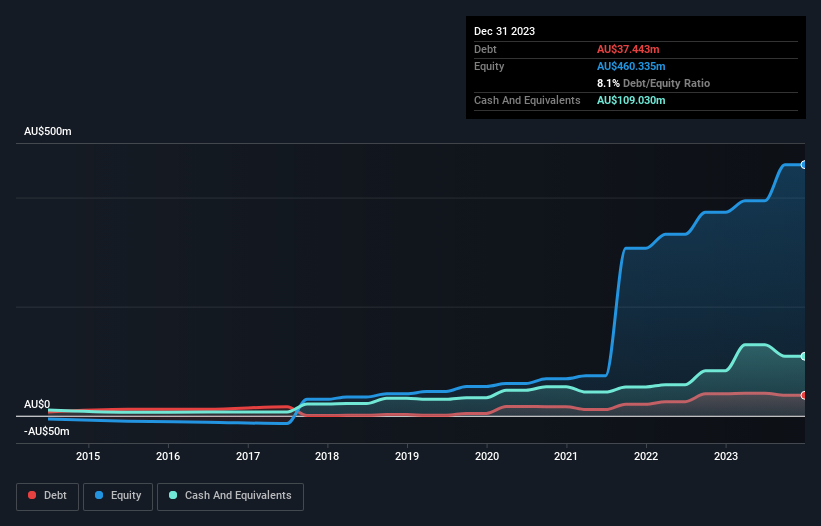
What Is Johns Lyng Group's Net Debt?
As you can see below, Johns Lyng Group had AU$37.4m of debt at December 2023, down from AU$40.1m a year prior. But it also has AU$109.0m in cash to offset that, meaning it has AU$71.6m net cash.
How Strong Is Johns Lyng Group's Balance Sheet?
The latest balance sheet data shows that Johns Lyng Group had liabilities of AU$272.4m due within a year, and liabilities of AU$67.5m falling due after that. Offsetting this, it had AU$109.0m in cash and AU$231.2m in receivables that were due within 12 months. So its total liabilities are just about perfectly matched by its shorter-term, liquid assets.
This state of affairs indicates that Johns Lyng Group's balance sheet looks quite solid, as its total liabilities are just about equal to its liquid assets. So it's very unlikely that the AU$1.70b company is short on cash, but still worth keeping an eye on the balance sheet. Simply put, the fact that Johns Lyng Group has more cash than debt is arguably a good indication that it can manage its debt safely.
Fortunately, Johns Lyng Group grew its EBIT by 7.2% in the last year, making that debt load look even more manageable. The balance sheet is clearly the area to focus on when you are analysing debt. But ultimately the future profitability of the business will decide if Johns Lyng Group can strengthen its balance sheet over time. So if you want to see what the professionals think, you might find this free report on analyst profit forecasts to be interesting.
But our final consideration is also important, because a company cannot pay debt with paper profits; it needs cold hard cash. While Johns Lyng Group has net cash on its balance sheet, it's still worth taking a look at its ability to convert earnings before interest and tax (EBIT) to free cash flow, to help us understand how quickly it is building (or eroding) that cash balance. During the last three years, Johns Lyng Group produced sturdy free cash flow equating to 66% of its EBIT, about what we'd expect. This cold hard cash means it can reduce its debt when it wants to.
Summing Up
While it is always sensible to investigate a company's debt, in this case Johns Lyng Group has AU$71.6m in net cash and a decent-looking balance sheet. And it impressed us with free cash flow of AU$83m, being 66% of its EBIT. So we don't think Johns Lyng Group's use of debt is risky. There's no doubt that we learn most about debt from the balance sheet. However, not all investment risk resides within the balance sheet - far from it. We've identified 2 warning signs with Johns Lyng Group , and understanding them should be part of your investment process.
Of course, if you're the type of investor who prefers buying stocks without the burden of debt, then don't hesitate to discover our exclusive list of net cash growth stocks, today.
New: Manage All Your Stock Portfolios in One Place
We've created the ultimate portfolio companion for stock investors, and it's free.
• Connect an unlimited number of Portfolios and see your total in one currency
• Be alerted to new Warning Signs or Risks via email or mobile
• Track the Fair Value of your stocks
Have feedback on this article? Concerned about the content? Get in touch with us directly. Alternatively, email editorial-team (at) simplywallst.com.
This article by Simply Wall St is general in nature. We provide commentary based on historical data and analyst forecasts only using an unbiased methodology and our articles are not intended to be financial advice. It does not constitute a recommendation to buy or sell any stock, and does not take account of your objectives, or your financial situation. We aim to bring you long-term focused analysis driven by fundamental data. Note that our analysis may not factor in the latest price-sensitive company announcements or qualitative material. Simply Wall St has no position in any stocks mentioned.
About ASX:JLG
Johns Lyng Group
Provides integrated building services in Australia, New Zealand, and the United States.
Excellent balance sheet and slightly overvalued.
Similar Companies
Market Insights

Advertisement
Community Narratives
The company that turned a verb into a global necessity and basically runs the modern internet, digital ads, smartphones, maps, and AI.
Fair Value US$300.00|6.2% undervalued
OS
Community Contributor
Flowers Foods Pays A Fair Price For Health
Fair Value US$16.12|25.1% undervalued
NV
Community Contributor
TMX Group will thrive with 33.3% profit margin and enduring market moat
Fair Value CA$49.90|0.04% overvalued
LI
Community Contributor