
Advertisement
- Australia
- /
- Construction
- /
- ASX:JLG
Some Confidence Is Lacking In Johns Lyng Group Limited (ASX:JLG) As Shares Slide 33%
Johns Lyng Group Limited (ASX:JLG) shareholders that were waiting for something to happen have been dealt a blow with a 33% share price drop in the last month. The drop over the last 30 days has capped off a tough year for shareholders, with the share price down 40% in that time.
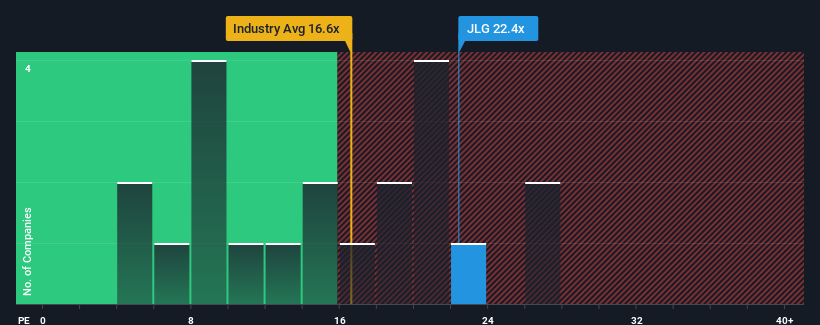
In spite of the heavy fall in price, Johns Lyng Group may still be sending bearish signals at the moment with its price-to-earnings (or "P/E") ratio of 22.4x, since almost half of all companies in Australia have P/E ratios under 19x and even P/E's lower than 10x are not unusual. Although, it's not wise to just take the P/E at face value as there may be an explanation why it's as high as it is.
Johns Lyng Group could be doing better as its earnings have been going backwards lately while most other companies have been seeing positive earnings growth. One possibility is that the P/E is high because investors think this poor earnings performance will turn the corner. If not, then existing shareholders may be extremely nervous about the viability of the share price.
Check out our latest analysis for Johns Lyng Group
How Is Johns Lyng Group's Growth Trending?
The only time you'd be truly comfortable seeing a P/E as high as Johns Lyng Group's is when the company's growth is on track to outshine the market.
Retrospectively, the last year delivered a frustrating 3.4% decrease to the company's bottom line. However, a few very strong years before that means that it was still able to grow EPS by an impressive 108% in total over the last three years. Although it's been a bumpy ride, it's still fair to say the earnings growth recently has been more than adequate for the company.
Shifting to the future, estimates from the twelve analysts covering the company suggest earnings should grow by 11% per year over the next three years. Meanwhile, the rest of the market is forecast to expand by 18% per annum, which is noticeably more attractive.
In light of this, it's alarming that Johns Lyng Group's P/E sits above the majority of other companies. Apparently many investors in the company are way more bullish than analysts indicate and aren't willing to let go of their stock at any price. There's a good chance these shareholders are setting themselves up for future disappointment if the P/E falls to levels more in line with the growth outlook.
The Key Takeaway
There's still some solid strength behind Johns Lyng Group's P/E, if not its share price lately. Using the price-to-earnings ratio alone to determine if you should sell your stock isn't sensible, however it can be a practical guide to the company's future prospects.
We've established that Johns Lyng Group currently trades on a much higher than expected P/E since its forecast growth is lower than the wider market. When we see a weak earnings outlook with slower than market growth, we suspect the share price is at risk of declining, sending the high P/E lower. Unless these conditions improve markedly, it's very challenging to accept these prices as being reasonable.
You always need to take note of risks, for example - Johns Lyng Group has 1 warning sign we think you should be aware of.
If these risks are making you reconsider your opinion on Johns Lyng Group, explore our interactive list of high quality stocks to get an idea of what else is out there.
New: Manage All Your Stock Portfolios in One Place
We've created the ultimate portfolio companion for stock investors, and it's free.
• Connect an unlimited number of Portfolios and see your total in one currency
• Be alerted to new Warning Signs or Risks via email or mobile
• Track the Fair Value of your stocks
Have feedback on this article? Concerned about the content? Get in touch with us directly. Alternatively, email editorial-team (at) simplywallst.com.
This article by Simply Wall St is general in nature. We provide commentary based on historical data and analyst forecasts only using an unbiased methodology and our articles are not intended to be financial advice. It does not constitute a recommendation to buy or sell any stock, and does not take account of your objectives, or your financial situation. We aim to bring you long-term focused analysis driven by fundamental data. Note that our analysis may not factor in the latest price-sensitive company announcements or qualitative material. Simply Wall St has no position in any stocks mentioned.
About ASX:JLG
Johns Lyng Group
Provides integrated building services in Australia, New Zealand, and the United States.
Excellent balance sheet and slightly overvalued.
Similar Companies
Market Insights

Advertisement
Community Narratives
The company that turned a verb into a global necessity and basically runs the modern internet, digital ads, smartphones, maps, and AI.
Fair Value US$300.00|5.2% undervalued
OS
Community Contributor
Flowers Foods Pays A Fair Price For Health
Fair Value US$16.12|24.9% undervalued
NV
Community Contributor
TMX Group will thrive with 33.3% profit margin and enduring market moat
Fair Value CA$49.90|3.3% overvalued
LI
Community Contributor
The "Molecular Pencil": Why Beam's Technology is Built to Win
Fair Value US$65.01|64.5% undervalued
DA
Community Contributor