Advertisement
- Japan
- /
- Trade Distributors
- /
- TSE:8158
Dividend Stocks To Consider In January 2025

Simply Wall St
Reviewed by Simply Wall St

As global markets navigate the early days of President Trump's administration, U.S. stocks are reaching new heights, buoyed by optimism around potential trade developments and AI investments. With major indices like the S&P 500 hitting record highs, investors are increasingly looking toward dividend stocks as a stable option amidst economic shifts and evolving policies. A good dividend stock typically offers consistent payouts and financial resilience, qualities that can be particularly appealing in times of market uncertainty and change.
Top 10 Dividend Stocks
| Name | Dividend Yield | Dividend Rating |
| Guaranty Trust Holding (NGSE:GTCO) | 5.94% | ★★★★★★ |
| Peoples Bancorp (NasdaqGS:PEBO) | 4.91% | ★★★★★★ |
| Wuliangye YibinLtd (SZSE:000858) | 4.05% | ★★★★★★ |
| Southside Bancshares (NYSE:SBSI) | 4.58% | ★★★★★★ |
| Padma Oil (DSE:PADMAOIL) | 7.45% | ★★★★★★ |
| China South Publishing & Media Group (SHSE:601098) | 4.01% | ★★★★★★ |
| Guangxi LiuYao Group (SHSE:603368) | 3.41% | ★★★★★★ |
| Citizens & Northern (NasdaqCM:CZNC) | 5.23% | ★★★★★★ |
| HUAYU Automotive Systems (SHSE:600741) | 4.46% | ★★★★★★ |
| DoshishaLtd (TSE:7483) | 3.76% | ★★★★★★ |
Click here to see the full list of 1938 stocks from our Top Dividend Stocks screener.
Here we highlight a subset of our preferred stocks from the screener.
Mashreqbank PSC (DFM:MASQ)
Simply Wall St Dividend Rating: ★★★★★☆
Overview: Mashreqbank PSC offers a range of banking and financial services to individuals and small businesses, with a market cap of AED43.53 billion.
Operations: Mashreqbank PSC generates revenue through diverse banking and financial services tailored for individuals and small businesses.
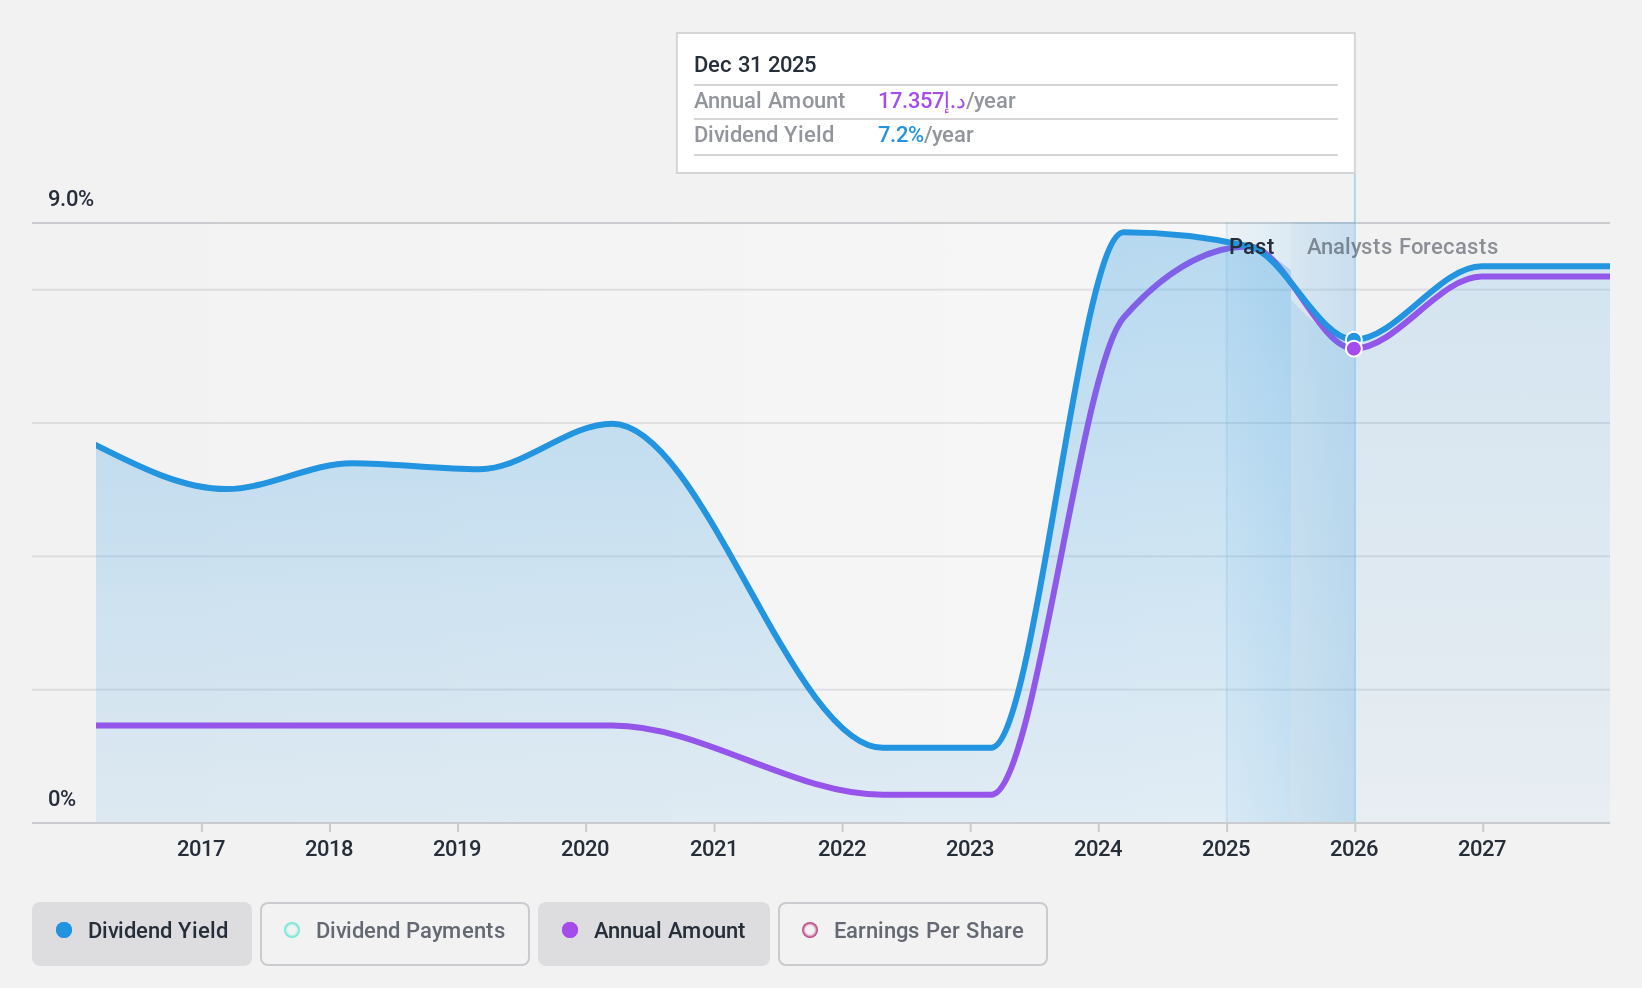
Dividend Yield: 7.8%
Mashreqbank PSC offers a dividend yield in the top 25% of the AE market, but its dividend history has been volatile over the past decade. Despite this, dividends are well-covered by earnings with a payout ratio of 43.2%, forecasted to rise to 51.2% in three years. Recent earnings results showed an increase in net income for both Q4 and full-year 2024, indicating potential stability for future payouts amidst strategic leadership changes aimed at growth and innovation.
- Take a closer look at Mashreqbank PSC's potential here in our dividend report.
- Upon reviewing our latest valuation report, Mashreqbank PSC's share price might be too pessimistic.
Oriental Shiraishi (TSE:1786)
Simply Wall St Dividend Rating: ★★★★☆☆
Overview: Oriental Shiraishi Corporation engages in the production, construction, and sale of prestressed concrete products and structures in Japan, with a market cap of ¥51.42 billion.
Operations: Oriental Shiraishi Corporation's revenue segments include ¥3.31 billion from the Port Business, ¥57.30 billion from the Construction Business, and ¥9.27 billion from the Steel Structure Business.
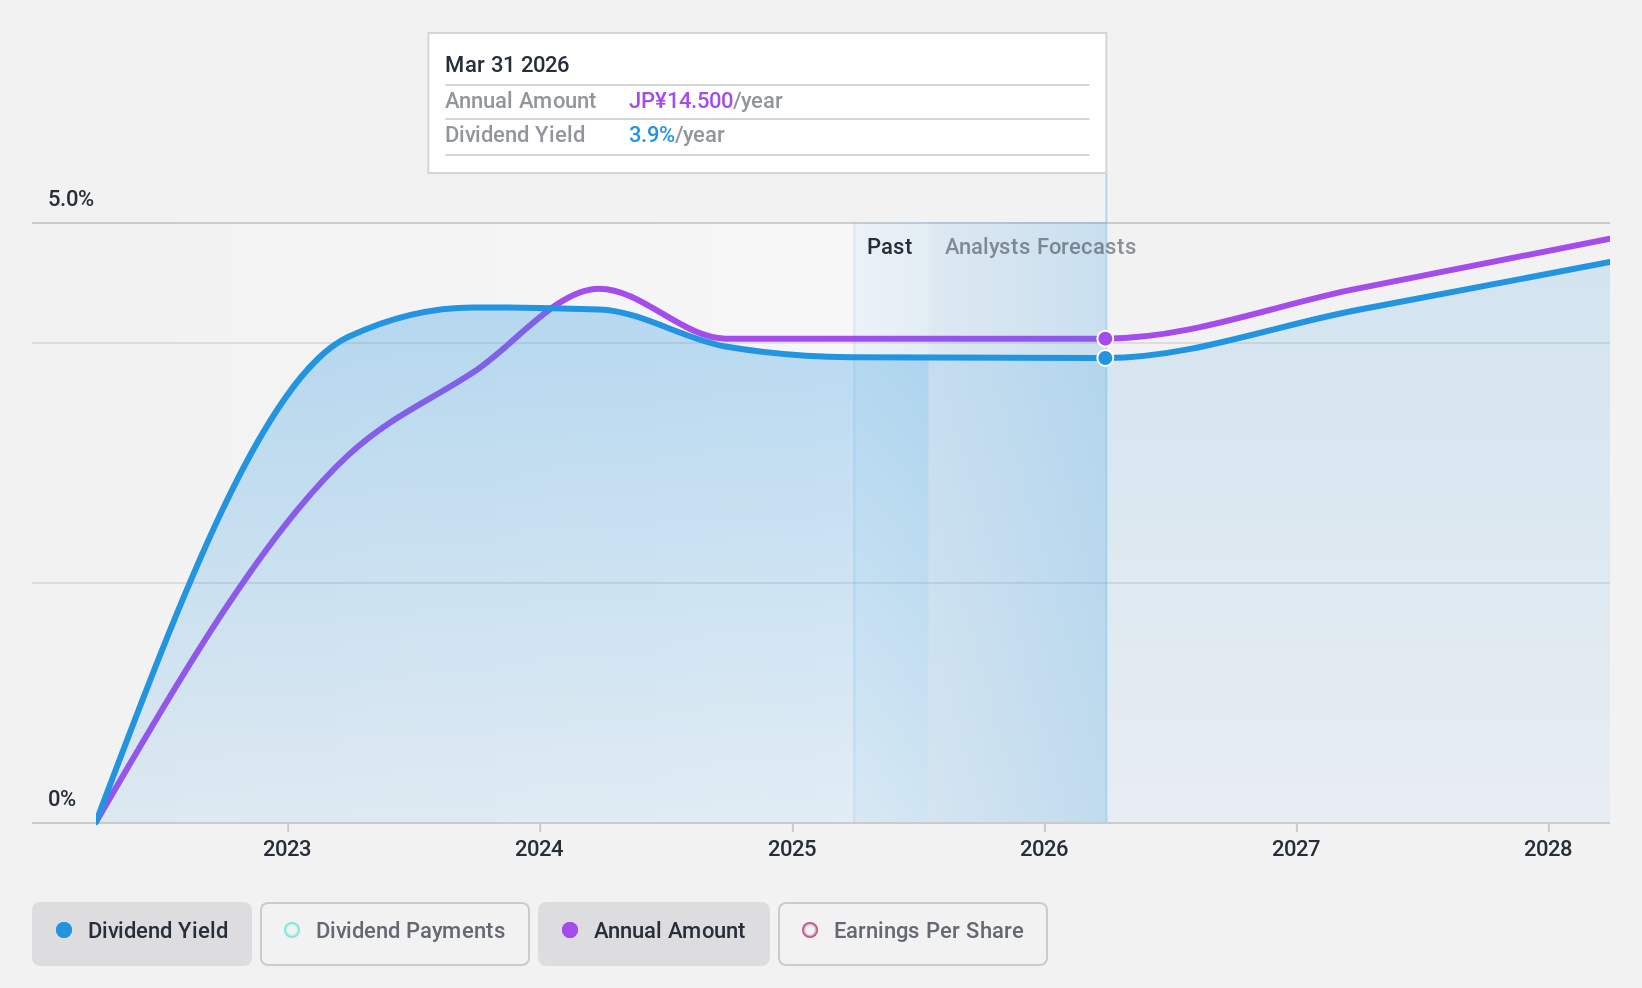
Dividend Yield: 3.8%
Oriental Shiraishi's dividend yield of 3.81% ranks in the top 25% of the JP market, supported by a low payout ratio of 34.9%, ensuring coverage by earnings and cash flows. Despite recent growth in earnings by 37.3%, future forecasts indicate a potential decline, raising concerns about sustainability. The company has increased its dividend to JPY 7 per share but has an unstable track record with volatile payments over its three-year history, highlighting reliability issues for investors seeking consistent returns.
- Click here and access our complete dividend analysis report to understand the dynamics of Oriental Shiraishi.
- Our valuation report here indicates Oriental Shiraishi may be undervalued.
Soda Nikka (TSE:8158)
Simply Wall St Dividend Rating: ★★★★☆☆
Overview: Soda Nikka Co., Ltd. is involved in the trading of chemicals both within Japan and internationally, with a market cap of ¥26.16 billion.
Operations: Soda Nikka Co., Ltd.'s revenue is primarily derived from its Chemicals Business, which accounts for ¥42.91 billion, and its Functional Materials Business, contributing ¥14.86 billion.
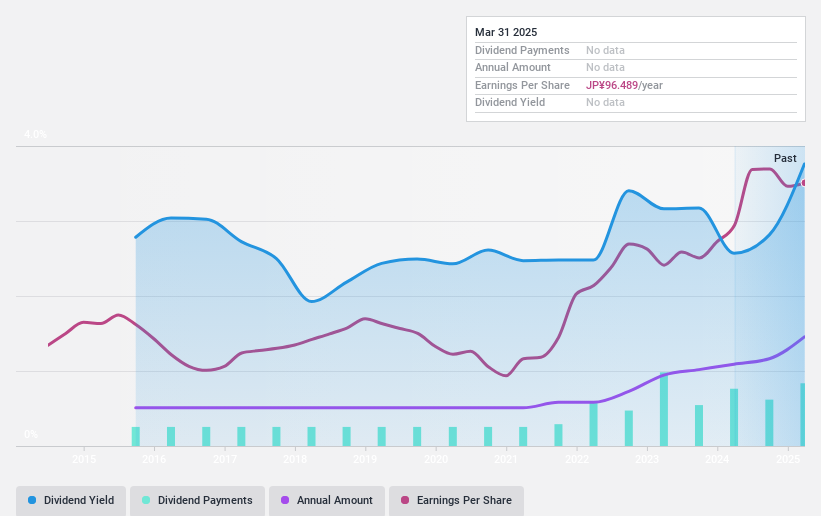
Dividend Yield: 3%
Soda Nikka's dividend yield of 3.01% is below the top quartile in Japan, with a payout ratio of 31.5%, indicating coverage by earnings but not free cash flows. Despite stable and growing dividends over the past decade, recent guidance suggests a decrease in year-end dividends from JPY 21 to JPY 17 per share for fiscal year ending March 2025. The company's price-to-earnings ratio stands at an attractive 11.1x compared to the market average of 13.7x, though impacted by large one-off items affecting earnings quality.
- Click to explore a detailed breakdown of our findings in Soda Nikka's dividend report.
- According our valuation report, there's an indication that Soda Nikka's share price might be on the expensive side.
Taking Advantage
- Take a closer look at our Top Dividend Stocks list of 1938 companies by clicking here.
- Have a stake in these businesses? Integrate your holdings into Simply Wall St's portfolio for notifications and detailed stock reports.
- Take control of your financial future using Simply Wall St, offering free, in-depth knowledge of international markets to every investor.
Interested In Other Possibilities?
- Explore high-performing small cap companies that haven't yet garnered significant analyst attention.
- Fuel your portfolio with companies showing strong growth potential, backed by optimistic outlooks both from analysts and management.
- Find companies with promising cash flow potential yet trading below their fair value.
This article by Simply Wall St is general in nature. We provide commentary based on historical data and analyst forecasts only using an unbiased methodology and our articles are not intended to be financial advice. It does not constitute a recommendation to buy or sell any stock, and does not take account of your objectives, or your financial situation. We aim to bring you long-term focused analysis driven by fundamental data. Note that our analysis may not factor in the latest price-sensitive company announcements or qualitative material. Simply Wall St has no position in any stocks mentioned.
New: Manage All Your Stock Portfolios in One Place
We've created the ultimate portfolio companion for stock investors, and it's free.
• Connect an unlimited number of Portfolios and see your total in one currency
• Be alerted to new Warning Signs or Risks via email or mobile
• Track the Fair Value of your stocks
Have feedback on this article? Concerned about the content? Get in touch with us directly. Alternatively, email editorial-team@simplywallst.com
About TSE:8158
Soda Nikka
Engages in the trading of chemicals in Japan and internationally.
Flawless balance sheet average dividend payer.
Market Insights


Advertisement
Community Narratives
MicroStrategy: Volatile Gamble or Golden Opportunity?
Fair Value US$663.00|32.0% undervalued
BL
Community Contributor
Emerging Markets and Debt Reduction Will Propel Bath & Body Works Forward
Fair Value US$40.73|21.7% undervalued
ZW
Community Contributor
An amazing opportunity to potentially get a 100 bagger
Fair Value US$10.00|0.5% overvalued
DA
Community Contributor