Stock Analysis
- United Arab Emirates
- /
- Banks
- /
- DFM:EMIRATESNBD
Investing in Emirates NBD Bank PJSC (DFM:EMIRATESNBD) five years ago would have delivered you a 136% gain


When we invest, we're generally looking for stocks that outperform the market average. And in our experience, buying the right stocks can give your wealth a significant boost. For example, the Emirates NBD Bank PJSC (DFM:EMIRATESNBD) share price is up 91% in the last 5 years, clearly besting the market decline of around 18% (ignoring dividends). On the other hand, the more recent gains haven't been so impressive, with shareholders gaining just 34% , including dividends .
So let's assess the underlying fundamentals over the last 5 years and see if they've moved in lock-step with shareholder returns.
See our latest analysis for Emirates NBD Bank PJSC
While the efficient markets hypothesis continues to be taught by some, it has been proven that markets are over-reactive dynamic systems, and investors are not always rational. One flawed but reasonable way to assess how sentiment around a company has changed is to compare the earnings per share (EPS) with the share price.
Over half a decade, Emirates NBD Bank PJSC managed to grow its earnings per share at 15% a year. This EPS growth is reasonably close to the 14% average annual increase in the share price. This indicates that investor sentiment towards the company has not changed a great deal. Rather, the share price has approximately tracked EPS growth.
The image below shows how EPS has tracked over time (if you click on the image you can see greater detail).
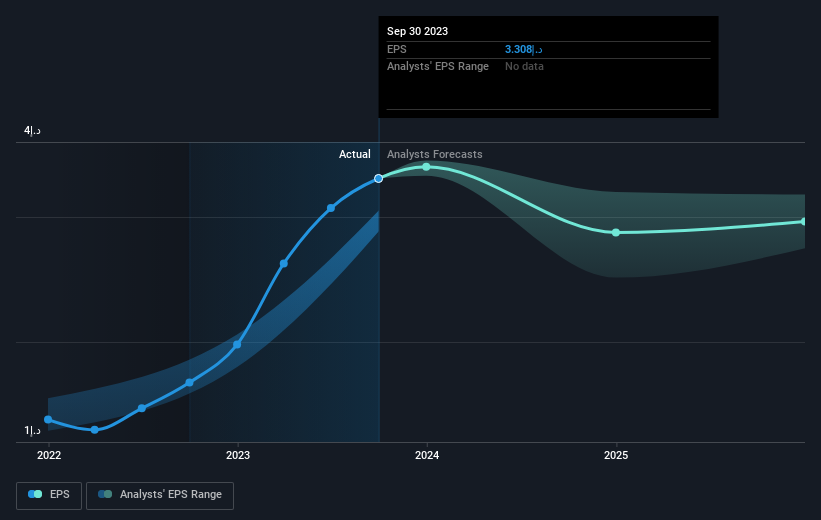
We know that Emirates NBD Bank PJSC has improved its bottom line over the last three years, but what does the future have in store? You can see how its balance sheet has strengthened (or weakened) over time in this free interactive graphic.
What About Dividends?
As well as measuring the share price return, investors should also consider the total shareholder return (TSR). The TSR incorporates the value of any spin-offs or discounted capital raisings, along with any dividends, based on the assumption that the dividends are reinvested. So for companies that pay a generous dividend, the TSR is often a lot higher than the share price return. As it happens, Emirates NBD Bank PJSC's TSR for the last 5 years was 136%, which exceeds the share price return mentioned earlier. This is largely a result of its dividend payments!
A Different Perspective
We're pleased to report that Emirates NBD Bank PJSC shareholders have received a total shareholder return of 34% over one year. That's including the dividend. That's better than the annualised return of 19% over half a decade, implying that the company is doing better recently. In the best case scenario, this may hint at some real business momentum, implying that now could be a great time to delve deeper. I find it very interesting to look at share price over the long term as a proxy for business performance. But to truly gain insight, we need to consider other information, too. Consider risks, for instance. Every company has them, and we've spotted 1 warning sign for Emirates NBD Bank PJSC you should know about.
For those who like to find winning investments this free list of growing companies with recent insider purchasing, could be just the ticket.
Please note, the market returns quoted in this article reflect the market weighted average returns of stocks that currently trade on Emirian exchanges.
Valuation is complex, but we're helping make it simple.
Find out whether Emirates NBD Bank PJSC is potentially over or undervalued by checking out our comprehensive analysis, which includes fair value estimates, risks and warnings, dividends, insider transactions and financial health.
View the Free AnalysisHave feedback on this article? Concerned about the content? Get in touch with us directly. Alternatively, email editorial-team (at) simplywallst.com.
This article by Simply Wall St is general in nature. We provide commentary based on historical data and analyst forecasts only using an unbiased methodology and our articles are not intended to be financial advice. It does not constitute a recommendation to buy or sell any stock, and does not take account of your objectives, or your financial situation. We aim to bring you long-term focused analysis driven by fundamental data. Note that our analysis may not factor in the latest price-sensitive company announcements or qualitative material. Simply Wall St has no position in any stocks mentioned.
About DFM:EMIRATESNBD
Emirates NBD Bank PJSC
Provides corporate, institutional, retail, treasury, and Islamic banking services.
6 star dividend payer with excellent balance sheet.
