- United Arab Emirates
- /
- Banks
- /
- ADX:SIB
Sharjah Islamic Bank PJSC (ADX:SIB) sheds 3.3% this week, as yearly returns fall more in line with earnings growth


The worst result, after buying shares in a company (assuming no leverage), would be if you lose all the money you put in. But on the bright side, if you buy shares in a high quality company at the right price, you can gain well over 100%. One great example is Sharjah Islamic Bank PJSC (ADX:SIB) which saw its share price drive 112% higher over five years. On the other hand, the stock price has retraced 3.3% in the last week.
Although Sharjah Islamic Bank PJSC has shed د.إ259m from its market cap this week, let's take a look at its longer term fundamental trends and see if they've driven returns.
Check out our latest analysis for Sharjah Islamic Bank PJSC
While markets are a powerful pricing mechanism, share prices reflect investor sentiment, not just underlying business performance. By comparing earnings per share (EPS) and share price changes over time, we can get a feel for how investor attitudes to a company have morphed over time.
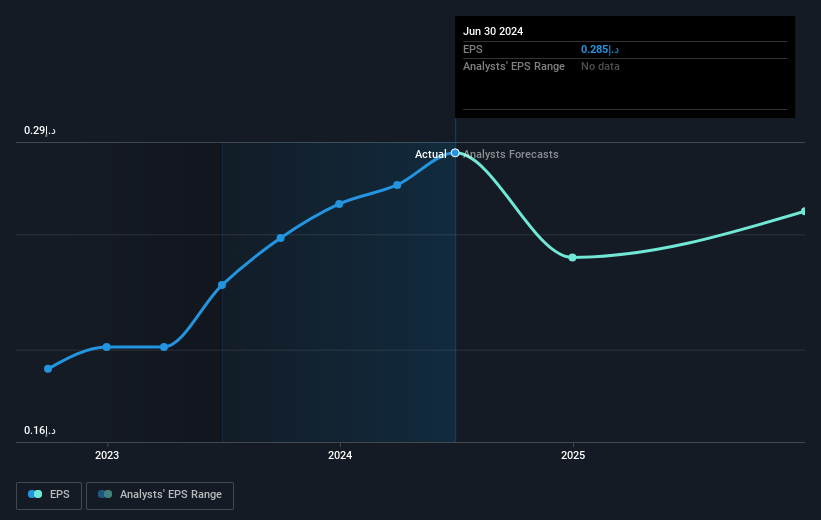
Over half a decade, Sharjah Islamic Bank PJSC managed to grow its earnings per share at 13% a year. This EPS growth is slower than the share price growth of 16% per year, over the same period. This suggests that market participants hold the company in higher regard, these days. And that's hardly shocking given the track record of growth.
The image below shows how EPS has tracked over time (if you click on the image you can see greater detail).
We know that Sharjah Islamic Bank PJSC has improved its bottom line lately, but is it going to grow revenue? Check if analysts think Sharjah Islamic Bank PJSC will grow revenue in the future.
What About Dividends?
It is important to consider the total shareholder return, as well as the share price return, for any given stock. The TSR is a return calculation that accounts for the value of cash dividends (assuming that any dividend received was reinvested) and the calculated value of any discounted capital raisings and spin-offs. It's fair to say that the TSR gives a more complete picture for stocks that pay a dividend. We note that for Sharjah Islamic Bank PJSC the TSR over the last 5 years was 167%, which is better than the share price return mentioned above. And there's no prize for guessing that the dividend payments largely explain the divergence!
A Different Perspective
We're pleased to report that Sharjah Islamic Bank PJSC shareholders have received a total shareholder return of 1.4% over one year. That's including the dividend. Having said that, the five-year TSR of 22% a year, is even better. Potential buyers might understandably feel they've missed the opportunity, but it's always possible business is still firing on all cylinders. I find it very interesting to look at share price over the long term as a proxy for business performance. But to truly gain insight, we need to consider other information, too. Even so, be aware that Sharjah Islamic Bank PJSC is showing 2 warning signs in our investment analysis , and 1 of those is potentially serious...
If you are like me, then you will not want to miss this free list of undervalued small caps that insiders are buying.
Please note, the market returns quoted in this article reflect the market weighted average returns of stocks that currently trade on Emirian exchanges.
New: Manage All Your Stock Portfolios in One Place
We've created the ultimate portfolio companion for stock investors, and it's free.
• Connect an unlimited number of Portfolios and see your total in one currency
• Be alerted to new Warning Signs or Risks via email or mobile
• Track the Fair Value of your stocks
Have feedback on this article? Concerned about the content? Get in touch with us directly. Alternatively, email editorial-team (at) simplywallst.com.
This article by Simply Wall St is general in nature. We provide commentary based on historical data and analyst forecasts only using an unbiased methodology and our articles are not intended to be financial advice. It does not constitute a recommendation to buy or sell any stock, and does not take account of your objectives, or your financial situation. We aim to bring you long-term focused analysis driven by fundamental data. Note that our analysis may not factor in the latest price-sensitive company announcements or qualitative material. Simply Wall St has no position in any stocks mentioned.
About ADX:SIB
Sharjah Islamic Bank PJSC
Provides banking products and services to individuals and corporates in the United Arab Emirates.
Adequate balance sheet with acceptable track record.

