
Advertisement
Today we'll evaluate Evolution Mining Limited (ASX:EVN) to determine whether it could have potential as an investment idea. Specifically, we're going to calculate its Return On Capital Employed (ROCE), in the hopes of getting some insight into the business.
First, we'll go over how we calculate ROCE. Second, we'll look at its ROCE compared to similar companies. And finally, we'll look at how its current liabilities are impacting its ROCE.
Return On Capital Employed (ROCE): What is it?
ROCE is a metric for evaluating how much pre-tax income (in percentage terms) a company earns on the capital invested in its business. Generally speaking a higher ROCE is better. In brief, it is a useful tool, but it is not without drawbacks. Author Edwin Whiting says to be careful when comparing the ROCE of different businesses, since 'No two businesses are exactly alike.
So, How Do We Calculate ROCE?
The formula for calculating the return on capital employed is:
Return on Capital Employed = Earnings Before Interest and Tax (EBIT) ÷ (Total Assets - Current Liabilities)
Or for Evolution Mining:
0.12 = AU$329m ÷ (AU$3.1b - AU$295m) (Based on the trailing twelve months to June 2019.)
Therefore, Evolution Mining has an ROCE of 12%.
See our latest analysis for Evolution Mining
Does Evolution Mining Have A Good ROCE?
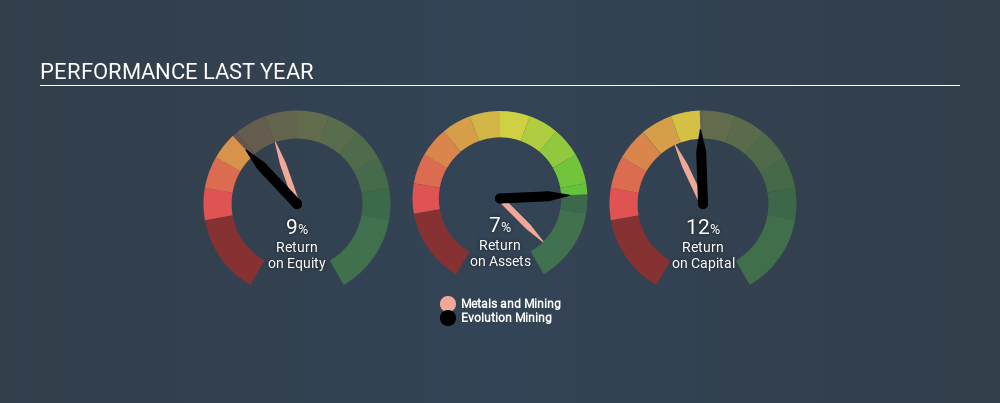
When making comparisons between similar businesses, investors may find ROCE useful. Using our data, we find that Evolution Mining's ROCE is meaningfully better than the 8.0% average in the Metals and Mining industry. I think that's good to see, since it implies the company is better than other companies at making the most of its capital. Regardless of where Evolution Mining sits next to its industry, its ROCE in absolute terms appears satisfactory, and this company could be worth a closer look.
Our data shows that Evolution Mining currently has an ROCE of 12%, compared to its ROCE of 9.0% 3 years ago. This makes us think about whether the company has been reinvesting shrewdly. You can see in the image below how Evolution Mining's ROCE compares to its industry. Click to see more on past growth.
When considering ROCE, bear in mind that it reflects the past and does not necessarily predict the future. ROCE can be misleading for companies in cyclical industries, with returns looking impressive during the boom times, but very weak during the busts. This is because ROCE only looks at one year, instead of considering returns across a whole cycle. We note Evolution Mining could be considered a cyclical business. Since the future is so important for investors, you should check out our free report on analyst forecasts for Evolution Mining.
Do Evolution Mining's Current Liabilities Skew Its ROCE?
Liabilities, such as supplier bills and bank overdrafts, are referred to as current liabilities if they need to be paid within 12 months. Due to the way ROCE is calculated, a high level of current liabilities makes a company look as though it has less capital employed, and thus can (sometimes unfairly) boost the ROCE. To counteract this, we check if a company has high current liabilities, relative to its total assets.
Evolution Mining has total assets of AU$3.1b and current liabilities of AU$295m. As a result, its current liabilities are equal to approximately 9.5% of its total assets. In addition to low current liabilities (making a negligible impact on ROCE), Evolution Mining earns a sound return on capital employed.
The Bottom Line On Evolution Mining's ROCE
If it is able to keep this up, Evolution Mining could be attractive. There might be better investments than Evolution Mining out there, but you will have to work hard to find them . These promising businesses with rapidly growing earnings might be right up your alley.
If you like to buy stocks alongside management, then you might just love this free list of companies. (Hint: insiders have been buying them).
If you spot an error that warrants correction, please contact the editor at editorial-team@simplywallst.com. This article by Simply Wall St is general in nature. It does not constitute a recommendation to buy or sell any stock, and does not take account of your objectives, or your financial situation. Simply Wall St has no position in the stocks mentioned.
We aim to bring you long-term focused research analysis driven by fundamental data. Note that our analysis may not factor in the latest price-sensitive company announcements or qualitative material. Thank you for reading.
About ASX:EVN
Evolution Mining
Engages in the exploration, mine development and operation, and sale of gold and gold-copper concentrates in Australia and Canada.
Solid track record with adequate balance sheet.
Similar Companies
Market Insights

Advertisement
Community Narratives
WhiteCap Is Positioned To Profit Regardless Of Trump's Policy 
Fair Value CA$22.60|61.5% undervalued
ST
Equity Analyst and Writer
Microsoft's Evolution Will Drive Revenue to New Heights Fueled by AI
Fair Value US$360.00|30.7% overvalued
BR
Community Contributor
A CASE FOR USD$2.50 (CAD$3.44) BY 2028 (A 5-10 BAGGER)
Fair Value CA$3.44|88.1% undervalued
AG
Community Contributor