Advertisement
- Australia
- /
- Commercial Services
- /
- ASX:SGF
Why SG Fleet Group Limited’s (ASX:SGF) Return On Capital Employed Is Impressive
Today we'll look at SG Fleet Group Limited (ASX:SGF) and reflect on its potential as an investment. Specifically, we're going to calculate its Return On Capital Employed (ROCE), in the hopes of getting some insight into the business.
First, we'll go over how we calculate ROCE. Then we'll compare its ROCE to similar companies. And finally, we'll look at how its current liabilities are impacting its ROCE.
What is Return On Capital Employed (ROCE)?
ROCE is a measure of a company's yearly pre-tax profit (its return), relative to the capital employed in the business. Generally speaking a higher ROCE is better. In brief, it is a useful tool, but it is not without drawbacks. Author Edwin Whiting says to be careful when comparing the ROCE of different businesses, since 'No two businesses are exactly alike.
So, How Do We Calculate ROCE?
Analysts use this formula to calculate return on capital employed:
Return on Capital Employed = Earnings Before Interest and Tax (EBIT) ÷ (Total Assets - Current Liabilities)
Or for SG Fleet Group:
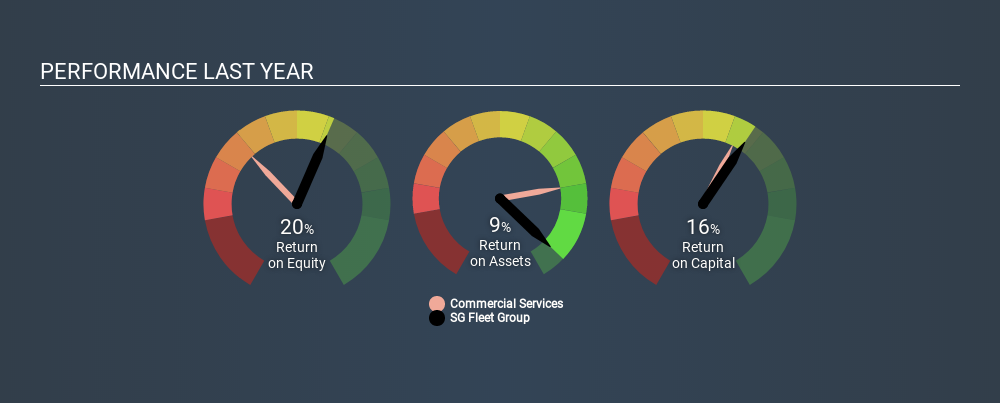
0.16 = AU$93m ÷ (AU$682m - AU$104m) (Based on the trailing twelve months to December 2019.)
Therefore, SG Fleet Group has an ROCE of 16%.
View our latest analysis for SG Fleet Group
Is SG Fleet Group's ROCE Good?
ROCE is commonly used for comparing the performance of similar businesses. Using our data, we find that SG Fleet Group's ROCE is meaningfully better than the 12% average in the Commercial Services industry. We consider this a positive sign, because it suggests it uses capital more efficiently than similar companies. Separate from SG Fleet Group's performance relative to its industry, its ROCE in absolute terms looks satisfactory, and it may be worth researching in more depth.
You can see in the image below how SG Fleet Group's ROCE compares to its industry. Click to see more on past growth.
When considering this metric, keep in mind that it is backwards looking, and not necessarily predictive. ROCE can be misleading for companies in cyclical industries, with returns looking impressive during the boom times, but very weak during the busts. This is because ROCE only looks at one year, instead of considering returns across a whole cycle. What happens in the future is pretty important for investors, so we have prepared a free report on analyst forecasts for SG Fleet Group.
SG Fleet Group's Current Liabilities And Their Impact On Its ROCE
Short term (or current) liabilities, are things like supplier invoices, overdrafts, or tax bills that need to be paid within 12 months. The ROCE equation subtracts current liabilities from capital employed, so a company with a lot of current liabilities appears to have less capital employed, and a higher ROCE than otherwise. To counter this, investors can check if a company has high current liabilities relative to total assets.
SG Fleet Group has current liabilities of AU$104m and total assets of AU$682m. Therefore its current liabilities are equivalent to approximately 15% of its total assets. Current liabilities are minimal, limiting the impact on ROCE.
The Bottom Line On SG Fleet Group's ROCE
Overall, SG Fleet Group has a decent ROCE and could be worthy of further research. SG Fleet Group shapes up well under this analysis, but it is far from the only business delivering excellent numbers . You might also want to check this free collection of companies delivering excellent earnings growth.
If you like to buy stocks alongside management, then you might just love this free list of companies. (Hint: insiders have been buying them).
Love or hate this article? Concerned about the content? Get in touch with us directly. Alternatively, email editorial-team@simplywallst.com.
This article by Simply Wall St is general in nature. It does not constitute a recommendation to buy or sell any stock, and does not take account of your objectives, or your financial situation. We aim to bring you long-term focused analysis driven by fundamental data. Note that our analysis may not factor in the latest price-sensitive company announcements or qualitative material. Simply Wall St has no position in any stocks mentioned. Thank you for reading.
About ASX:SGF
SG Fleet Group
Provides motor vehicle fleet management, vehicle leasing, short-term hire, consumer vehicle finance, and salary packaging services in Australia, New Zealand, and the United Kingdom.
Undervalued second-rate dividend payer.
Market Insights


Advertisement
Weekly Picks
CE


Ceazar on Conexeu Sciences ·
This small biotech is developing technology that could potentially change how tissue is rebuilt
Fair Value:US$25.3447.6% undervalued
25 followersusers have followed this narrative
0 commentsusers have commented on this narrative
3 likesusers have liked this narrative
HE


HedgeY on Quanta Services ·
The Picks-and-Shovels Leader of the Grid Supercycle
Fair Value:US$7101.1% undervalued
49 followersusers have followed this narrative
0 commentsusers have commented on this narrative
4 likesusers have liked this narrative
FU

FundamentalFlow on Karman Holdings ·
KRMN — Karman Space & Defense: Down 58% from Peak, Is the Market Mispricing a Hypergrowth Defense Compounder?
Fair Value:US$105.652.3% undervalued
28 followersusers have followed this narrative
2 commentsusers have commented on this narrative
13 likesusers have liked this narrative
DO


Double_Bubbler on Invinity Energy Systems ·
Invinity Energy Systems: All About That BESS
Fair Value:UK£161.8% undervalued
35 followersusers have followed this narrative
0 commentsusers have commented on this narrative
5 likesusers have liked this narrative
Recently Updated Narratives
LY
Lyra on DT Cloud Star Acquisition ·
A SPAC in the Endgame Between Lifeboat and Siren Song
Fair Value:US$6.1584.4% overvalued
1 followerusers have followed this narrative
0 commentsusers have commented on this narrative
0 likesusers have liked this narrative
IN


Investingwilly on Mastercard ·
Mastercard: The Best Dividend Stock You're Ignoring
Fair Value:US$75034.7% undervalued
2 followersusers have followed this narrative
0 commentsusers have commented on this narrative
0 likesusers have liked this narrative
RO


RockeTeller on Luca Mining ·
Luca Mining, $176M Revenue, Strong FCF, 200K Oz AuEq Vision & Debt-Free by Mid-2026
Fair Value:CA$3.9972.4% undervalued
5 followersusers have followed this narrative
1 commentusers have commented on this narrative
1 likeusers have liked this narrative
Popular Narratives
MA


martinarauz on Nu Holdings ·
Investment Analysis (May 2026)
Fair Value:US$22.7444.1% undervalued
68 followersusers have followed this narrative
0 commentsusers have commented on this narrative
16 likesusers have liked this narrative
HA


HarishPK on Adobe ·
Adobe: A Probabilistic Case for Undervaluation
Fair Value:US$319.9639.0% undervalued
58 followersusers have followed this narrative
9 commentsusers have commented on this narrative
17 likesusers have liked this narrative
NI


niteco on Honeywell International ·
Honeywell - The Demand-Side of the AI Infrastructure
Fair Value:US$320.1928.5% undervalued
52 followersusers have followed this narrative
0 commentsusers have commented on this narrative
19 likesusers have liked this narrative
