
Advertisement
- Belgium
- /
- Diversified Financial
- /
- ENXTBR:MONNI
Why Keyware Technologies NV’s (EBR:KEYW) Use Of Investor Capital Doesn’t Look Great
Today we'll evaluate Keyware Technologies NV (EBR:KEYW) to determine whether it could have potential as an investment idea. To be precise, we'll consider its Return On Capital Employed (ROCE), as that will inform our view of the quality of the business.
Firstly, we'll go over how we calculate ROCE. Then we'll compare its ROCE to similar companies. Last but not least, we'll look at what impact its current liabilities have on its ROCE.
What is Return On Capital Employed (ROCE)?
ROCE measures the amount of pre-tax profits a company can generate from the capital employed in its business. Generally speaking a higher ROCE is better. Overall, it is a valuable metric that has its flaws. Author Edwin Whiting says to be careful when comparing the ROCE of different businesses, since 'No two businesses are exactly alike.
So, How Do We Calculate ROCE?
The formula for calculating the return on capital employed is:
Return on Capital Employed = Earnings Before Interest and Tax (EBIT) ÷ (Total Assets - Current Liabilities)
Or for Keyware Technologies:
0.011 = €367k ÷ (€39m - €6.1m) (Based on the trailing twelve months to December 2019.)
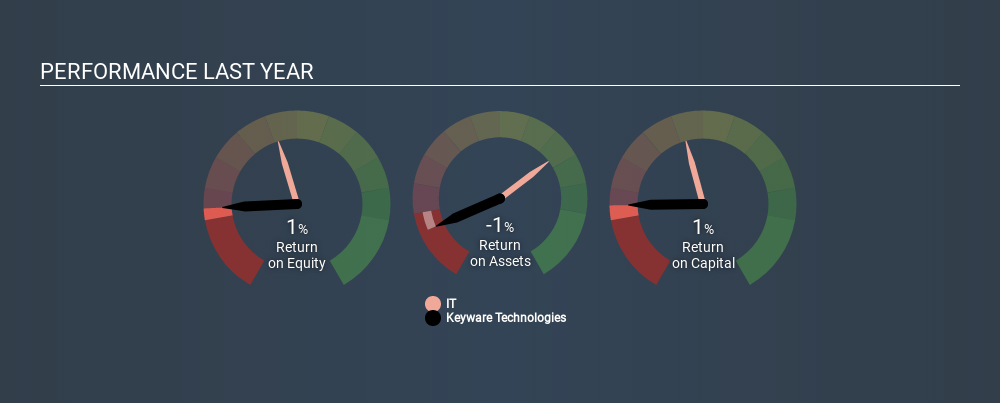
So, Keyware Technologies has an ROCE of 1.1%.
See our latest analysis for Keyware Technologies
Does Keyware Technologies Have A Good ROCE?
One way to assess ROCE is to compare similar companies. Using our data, Keyware Technologies's ROCE appears to be significantly below the 13% average in the IT industry. This performance is not ideal, as it suggests the company may not be deploying its capital as effectively as some competitors. Regardless of how Keyware Technologies stacks up against its industry, its ROCE in absolute terms is quite low (especially compared to a bank account). Readers may wish to look for more rewarding investments.
Keyware Technologies's current ROCE of 1.1% is lower than its ROCE in the past, which was 10%, 3 years ago. So investors might consider if it has had issues recently. You can click on the image below to see (in greater detail) how Keyware Technologies's past growth compares to other companies.
When considering ROCE, bear in mind that it reflects the past and does not necessarily predict the future. ROCE can be deceptive for cyclical businesses, as returns can look incredible in boom times, and terribly low in downturns. ROCE is, after all, simply a snap shot of a single year. How cyclical is Keyware Technologies? You can see for yourself by looking at this free graph of past earnings, revenue and cash flow.
What Are Current Liabilities, And How Do They Affect Keyware Technologies's ROCE?
Current liabilities are short term bills and invoices that need to be paid in 12 months or less. Due to the way ROCE is calculated, a high level of current liabilities makes a company look as though it has less capital employed, and thus can (sometimes unfairly) boost the ROCE. To counter this, investors can check if a company has high current liabilities relative to total assets.
Keyware Technologies has total assets of €39m and current liabilities of €6.1m. As a result, its current liabilities are equal to approximately 15% of its total assets. With a very reasonable level of current liabilities, so the impact on ROCE is fairly minimal.
Our Take On Keyware Technologies's ROCE
While that is good to see, Keyware Technologies has a low ROCE and does not look attractive in this analysis. Of course, you might also be able to find a better stock than Keyware Technologies. So you may wish to see this free collection of other companies that have grown earnings strongly.
If you like to buy stocks alongside management, then you might just love this free list of companies. (Hint: insiders have been buying them).
Love or hate this article? Concerned about the content? Get in touch with us directly. Alternatively, email editorial-team@simplywallst.com.
This article by Simply Wall St is general in nature. It does not constitute a recommendation to buy or sell any stock, and does not take account of your objectives, or your financial situation. We aim to bring you long-term focused analysis driven by fundamental data. Note that our analysis may not factor in the latest price-sensitive company announcements or qualitative material. Simply Wall St has no position in any stocks mentioned. Thank you for reading.
About ENXTBR:MONNI
Monni
Provides electronic payment solutions in Belgium, France, and internationally.
Excellent balance sheet average dividend payer.
Similar Companies
Market Insights


Advertisement
Weekly Picks
CE


Ceazar on Sparc AI ·
When GPS fails: this small cap is fixing a $54B drone problem
Fair Value:CA$5.2533.3% undervalued
158 followersusers have followed this narrative
0 commentsusers have commented on this narrative
27 likesusers have liked this narrative
HA


HarishPK on Amdocs ·
Why Amdocs is a high conviction Buy for me?
Fair Value:US$82.0328.6% undervalued
35 followersusers have followed this narrative
3 commentsusers have commented on this narrative
12 likesusers have liked this narrative
IV

Ivoed on SBM Offshore ·
Why SBM Offshore’s €30 Share Price May Be Too Harsh On Its Backlog
Fair Value:€44.527.2% undervalued
19 followersusers have followed this narrative
0 commentsusers have commented on this narrative
5 likesusers have liked this narrative
CL


Clive_Thompson on Green Tea Group ·
One of China's Fastest-Growing Restaurant Chains Trades on Just 7x Earnings and an 8% Dividend
Fair Value:HK$8.723.9% undervalued
47 followersusers have followed this narrative
3 commentsusers have commented on this narrative
20 likesusers have liked this narrative
Recently Updated Narratives
RO


RockeTeller on Southern Silver Exploration ·
302 Million Oz Silver Project in Mexico: Low Cost Underground Giant Ready to Explode
Fair Value:CA$32.198.0% undervalued
5 followersusers have followed this narrative
0 commentsusers have commented on this narrative
0 likesusers have liked this narrative
J_


J_Tyrader on Oscar Health ·
7/8/26 — Oscar Health: Trading 95.4% below Fair Value with +2070.2% Upside Potential
Fair Value:US$583.3495.2% undervalued
5 followersusers have followed this narrative
0 commentsusers have commented on this narrative
0 likesusers have liked this narrative
AN


andre_santos on Procter & Gamble ·
Procter & Gamble - A Fundamental Valuation
Fair Value:US$107.5235.6% overvalued
26 followersusers have followed this narrative
2 commentsusers have commented on this narrative
0 likesusers have liked this narrative
Popular Narratives
OS


oscargarcia on NVIDIA ·
The company that went from selling GPUs to gamers to becoming the AI arms dealer of the 21st century.
Fair Value:US$28020.0% undervalued
276 followersusers have followed this narrative
9 commentsusers have commented on this narrative
16 likesusers have liked this narrative
CU

CubanEros on Microsoft ·
A wonderful business at reasonable price.
Fair Value:US$419.9119.1% overvalued
142 followersusers have followed this narrative
0 commentsusers have commented on this narrative
8 likesusers have liked this narrative
KI

KiwiInvest on Amazon.com ·
Amazon's high growth, high tech segments propel its profits, while traditional segments plod along
Fair Value:US$475.0942.2% undervalued
166 followersusers have followed this narrative
1 commentusers have commented on this narrative
8 likesusers have liked this narrative
Trending Discussion
YA


Yash_Upadhyaya on Reddit ·
Steve blamed "choppy" Google referral traffic for the miss on US daily active user (DAU) WHILST being in a standoff with Google on the AI licensing deal... hmm 🤔 One way or another a deal is happening. What's gonna be interesting is to see how good or bad (which the market is pricing in) would it be. PS - I don't own the stock but like the company.
1
|0
