Advertisement
Why Broad Gate S.A.’s (WSE:BDG) Return On Capital Employed Might Be A Concern
Want to participate in a short research study? Help shape the future of investing tools and you could win a $250 gift card!
Today we'll look at Broad Gate S.A. (WSE:BDG) and reflect on its potential as an investment. Specifically, we're going to calculate its Return On Capital Employed (ROCE), in the hopes of getting some insight into the business.
First up, we'll look at what ROCE is and how we calculate it. Second, we'll look at its ROCE compared to similar companies. Last but not least, we'll look at what impact its current liabilities have on its ROCE.
What is Return On Capital Employed (ROCE)?
ROCE measures the 'return' (pre-tax profit) a company generates from capital employed in its business. Generally speaking a higher ROCE is better. Ultimately, it is a useful but imperfect metric. Author Edwin Whiting says to be careful when comparing the ROCE of different businesses, since 'No two businesses are exactly alike.'
So, How Do We Calculate ROCE?
Analysts use this formula to calculate return on capital employed:
Return on Capital Employed = Earnings Before Interest and Tax (EBIT) ÷ (Total Assets - Current Liabilities)
Or for Broad Gate:
0.038 = zł1.7m ÷ (zł88m - zł42m) (Based on the trailing twelve months to March 2019.)
So, Broad Gate has an ROCE of 3.8%.
View our latest analysis for Broad Gate
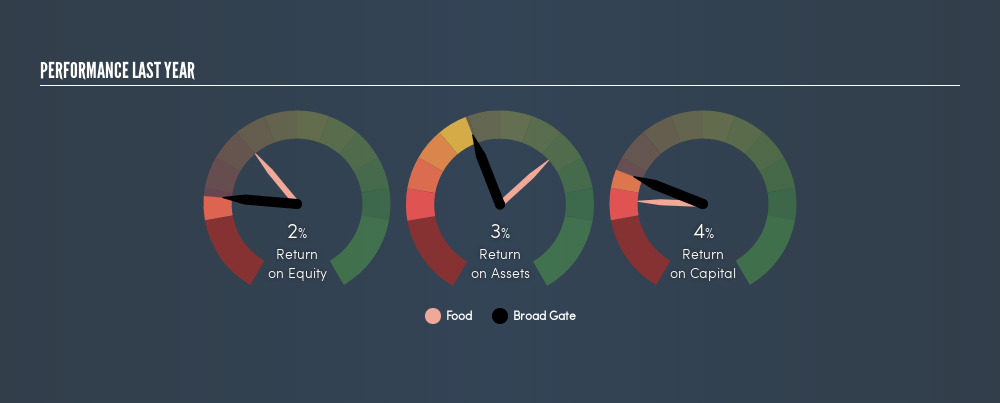
Is Broad Gate's ROCE Good?
ROCE can be useful when making comparisons, such as between similar companies. In this analysis, Broad Gate's ROCE appears meaningfully below the 12% average reported by the Food industry. This performance could be negative if sustained, as it suggests the business may underperform its industry. Putting aside Broad Gate's performance relative to its industry, its ROCE in absolute terms is poor - considering the risk of owning stocks compared to government bonds. It is likely that there are more attractive prospects out there.
In our analysis, Broad Gate's ROCE appears to be 3.8%, compared to 3 years ago, when its ROCE was 1.5%. This makes us think the business might be improving.
When considering this metric, keep in mind that it is backwards looking, and not necessarily predictive. Companies in cyclical industries can be difficult to understand using ROCE, as returns typically look high during boom times, and low during busts. This is because ROCE only looks at one year, instead of considering returns across a whole cycle. How cyclical is Broad Gate? You can see for yourself by looking at this free graph of past earnings, revenue and cash flow.
Do Broad Gate's Current Liabilities Skew Its ROCE?
Liabilities, such as supplier bills and bank overdrafts, are referred to as current liabilities if they need to be paid within 12 months. Due to the way ROCE is calculated, a high level of current liabilities makes a company look as though it has less capital employed, and thus can (sometimes unfairly) boost the ROCE. To counter this, investors can check if a company has high current liabilities relative to total assets.
Broad Gate has total liabilities of zł42m and total assets of zł88m. As a result, its current liabilities are equal to approximately 48% of its total assets. With a medium level of current liabilities boosting the ROCE a little, Broad Gate's low ROCE is unappealing.
What We Can Learn From Broad Gate's ROCE
This company may not be the most attractive investment prospect. You might be able to find a better investment than Broad Gate. If you want a selection of possible winners, check out this free list of interesting companies that trade on a P/E below 20 (but have proven they can grow earnings).
For those who like to find winning investments this free list of growing companies with recent insider purchasing, could be just the ticket.
We aim to bring you long-term focused research analysis driven by fundamental data. Note that our analysis may not factor in the latest price-sensitive company announcements or qualitative material.
If you spot an error that warrants correction, please contact the editor at editorial-team@simplywallst.com. This article by Simply Wall St is general in nature. It does not constitute a recommendation to buy or sell any stock, and does not take account of your objectives, or your financial situation. Simply Wall St has no position in the stocks mentioned. Thank you for reading.
Market Insights


Advertisement
Weekly Picks
LO


Lou_Basenese on Giftify ·
Giftify ($GIFT): A Small-Cap Incentives Platform with More ScaleThan Its Valuation Suggests
Fair Value:US$2.563.5% undervalued
59 followersusers have followed this narrative
2 commentsusers have commented on this narrative
11 likesusers have liked this narrative
HA


HarishPK on lululemon athletica ·
Quantifying the Transition: Why Lululemon’s Moat Remains Intact
Fair Value:US$161.826.3% undervalued
22 followersusers have followed this narrative
2 commentsusers have commented on this narrative
9 likesusers have liked this narrative
TR


tripledub on Alphabet ·
Warren Buffett Just Bet $10 Billion on Google. The Catch? You May Already Be Too Late.
Fair Value:US$23055.3% overvalued
61 followersusers have followed this narrative
1 commentusers have commented on this narrative
16 likesusers have liked this narrative
JO


John_Eric on Veeva Systems ·
AI-Powered Veeva Systems Poised for Solid Growth Amid Regulatory Stability
Fair Value:US$32040.6% undervalued
32 followersusers have followed this narrative
0 commentsusers have commented on this narrative
6 likesusers have liked this narrative
Recently Updated Narratives
PI

PittTheYounger on Delta Air Lines ·
Delta loses shine after warning of falling travel demand, but still industry leader
Fair Value:US$63.2138.3% overvalued
19 followersusers have followed this narrative
0 commentsusers have commented on this narrative
0 likesusers have liked this narrative
PI

PittTheYounger on easyJet ·
EasyJet weirdly unloved by investors in spite of relatively attractive metrics
Fair Value:UK£6.953.3% undervalued
36 followersusers have followed this narrative
10 commentsusers have commented on this narrative
0 likesusers have liked this narrative
TI

TimLee on Minox International Group Berhad ·
Minox International: Undervalued Industrial Play with High-Tech Catalysts
Fair Value:RM 0.3555.7% undervalued
1 followerusers have followed this narrative
0 commentsusers have commented on this narrative
0 likesusers have liked this narrative
Popular Narratives
IN


Investingwilly on Mastercard ·
Mastercard: The Best Dividend Stock You're Ignoring
Fair Value:US$75029.8% undervalued
87 followersusers have followed this narrative
1 commentusers have commented on this narrative
9 likesusers have liked this narrative
BL


BlackGoat on Cerebras Systems ·
The Wafer Giant Threatening NVIDIA's GPU Hegemony
Fair Value:US$415.5448.2% undervalued
60 followersusers have followed this narrative
3 commentsusers have commented on this narrative
11 likesusers have liked this narrative
TR
tripledub on Alphabet ·
Warren Buffett Just Bet $10 Billion on Google. The Catch? You May Already Be Too Late.
Fair Value:US$23055.3% overvalued
61 followersusers have followed this narrative
1 commentusers have commented on this narrative
16 likesusers have liked this narrative
