
Advertisement
- India
- /
- Professional Services
- /
- NSEI:ONEPOINT
What Is One Point One Solutions's (NSE:ONEPOINT) P/E Ratio After Its Share Price Rocketed?

One Point One Solutions (NSE:ONEPOINT) shares have continued recent momentum with a 36% gain in the last month alone. But shareholders may not all be feeling jubilant, since the share price is still down 21% in the last year.
Assuming no other changes, a sharply higher share price makes a stock less attractive to potential buyers. In the long term, share prices tend to follow earnings per share, but in the short term prices bounce around in response to short term factors (which are not always obvious). So some would prefer to hold off buying when there is a lot of optimism towards a stock. One way to gauge market expectations of a stock is to look at its Price to Earnings Ratio (PE Ratio). A high P/E ratio means that investors have a high expectation about future growth, while a low P/E ratio means they have low expectations about future growth.
View our latest analysis for One Point One Solutions
Does One Point One Solutions Have A Relatively High Or Low P/E For Its Industry?
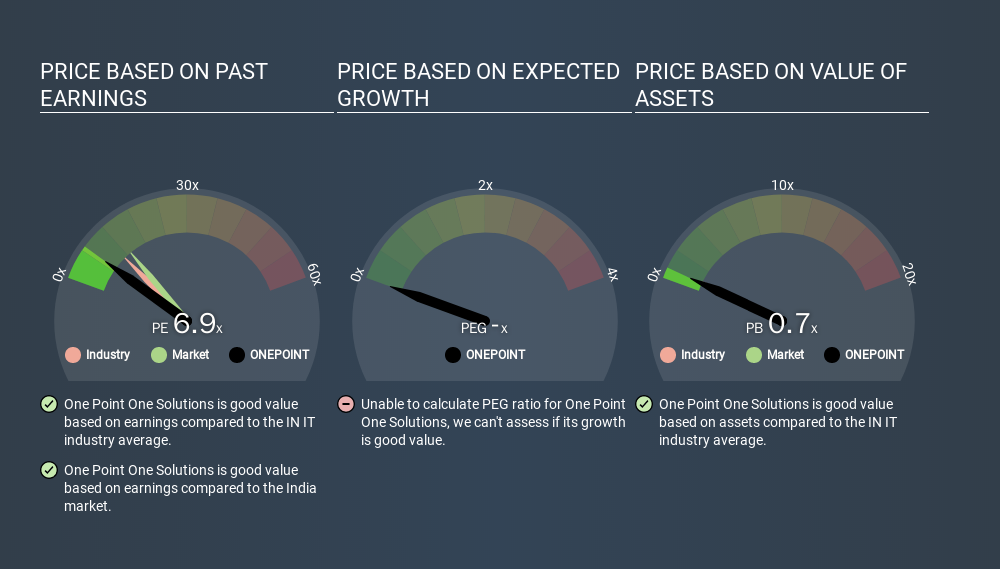
One Point One Solutions's P/E of 6.92 indicates relatively low sentiment towards the stock. We can see in the image below that the average P/E (11.2) for companies in the it industry is higher than One Point One Solutions's P/E.
One Point One Solutions's P/E tells us that market participants think it will not fare as well as its peers in the same industry. While current expectations are low, the stock could be undervalued if the situation is better than the market assumes. It is arguably worth checking if insiders are buying shares, because that might imply they believe the stock is undervalued.
How Growth Rates Impact P/E Ratios
If earnings fall then in the future the 'E' will be lower. Therefore, even if you pay a low multiple of earnings now, that multiple will become higher in the future. A higher P/E should indicate the stock is expensive relative to others -- and that may encourage shareholders to sell.
One Point One Solutions shrunk earnings per share by 42% over the last year. And over the longer term (5 years) earnings per share have decreased 7.3% annually. This could justify a pessimistic P/E.
A Limitation: P/E Ratios Ignore Debt and Cash In The Bank
Don't forget that the P/E ratio considers market capitalization. In other words, it does not consider any debt or cash that the company may have on the balance sheet. Theoretically, a business can improve its earnings (and produce a lower P/E in the future) by investing in growth. That means taking on debt (or spending its cash).
Such expenditure might be good or bad, in the long term, but the point here is that the balance sheet is not reflected by this ratio.
So What Does One Point One Solutions's Balance Sheet Tell Us?
Net debt totals just 2.3% of One Point One Solutions's market cap. So it doesn't have as many options as it would with net cash, but its debt would not have much of an impact on its P/E ratio.
The Bottom Line On One Point One Solutions's P/E Ratio
One Point One Solutions has a P/E of 6.9. That's below the average in the IN market, which is 13.3. With only modest debt, it's likely the lack of EPS growth at least partially explains the pessimism implied by the P/E ratio. What we know for sure is that investors are becoming less uncomfortable about One Point One Solutions's prospects, since they have pushed its P/E ratio from 5.1 to 6.9 over the last month. If you like to buy stocks that could be turnaround opportunities, then this one might be a candidate; but if you're more sensitive to price, then you may feel the opportunity has passed.
Investors should be looking to buy stocks that the market is wrong about. If the reality for a company is not as bad as the P/E ratio indicates, then the share price should increase as the market realizes this. We don't have analyst forecasts, but shareholders might want to examine this detailed historical graph of earnings, revenue and cash flow.
But note: One Point One Solutions may not be the best stock to buy. So take a peek at this free list of interesting companies with strong recent earnings growth (and a P/E ratio below 20).
If you spot an error that warrants correction, please contact the editor at editorial-team@simplywallst.com. This article by Simply Wall St is general in nature. It does not constitute a recommendation to buy or sell any stock, and does not take account of your objectives, or your financial situation. Simply Wall St has no position in the stocks mentioned.
We aim to bring you long-term focused research analysis driven by fundamental data. Note that our analysis may not factor in the latest price-sensitive company announcements or qualitative material. Thank you for reading.
About NSEI:ONEPOINT
One Point One Solutions
Engages in the customer life cycle management, business process management, and technology servicing activities in India.
Flawless balance sheet with proven track record.
Similar Companies
Market Insights

Advertisement
Community Narratives
Vita Life Sciences Set for a 12.72% Revenue Growth While Tackling Operational Challenges
Fair Value AU$2.42|8.7% undervalued
RO
Community Contributor
Vossloh rides a €500 billion wave to boost growth and earnings in the next decade
Fair Value €78.41|6.3% undervalued
CH
Community Contributor
Intuitive Surgical Will Transform Healthcare with 12% Revenue Growth
Fair Value US$325.55|56.5% overvalued
UN
Community Contributor