Advertisement
- United States
- /
- Semiconductors
- /
- NasdaqGS:AMAT
What Is Applied Materials's (NASDAQ:AMAT) P/E Ratio After Its Share Price Tanked?
To the annoyance of some shareholders, Applied Materials (NASDAQ:AMAT) shares are down a considerable 31% in the last month. The stock has been solid, longer term, gaining 12% in the last year.
Assuming nothing else has changed, a lower share price makes a stock more attractive to potential buyers. While the market sentiment towards a stock is very changeable, in the long run, the share price will tend to move in the same direction as earnings per share. The implication here is that long term investors have an opportunity when expectations of a company are too low. One way to gauge market expectations of a stock is to look at its Price to Earnings Ratio (PE Ratio). Investors have optimistic expectations of companies with higher P/E ratios, compared to companies with lower P/E ratios.
View our latest analysis for Applied Materials
How Does Applied Materials's P/E Ratio Compare To Its Peers?
Applied Materials's P/E of 14.81 indicates relatively low sentiment towards the stock. The image below shows that Applied Materials has a lower P/E than the average (25.2) P/E for companies in the semiconductor industry.
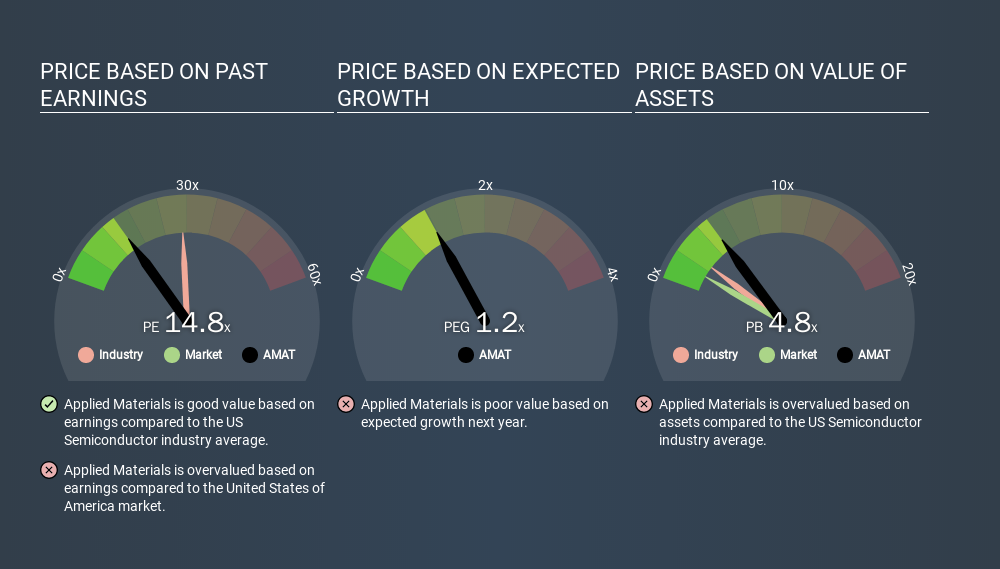
Its relatively low P/E ratio indicates that Applied Materials shareholders think it will struggle to do as well as other companies in its industry classification. Many investors like to buy stocks when the market is pessimistic about their prospects. If you consider the stock interesting, further research is recommended. For example, I often monitor director buying and selling.
How Growth Rates Impact P/E Ratios
Probably the most important factor in determining what P/E a company trades on is the earnings growth. Earnings growth means that in the future the 'E' will be higher. That means unless the share price increases, the P/E will reduce in a few years. Then, a lower P/E should attract more buyers, pushing the share price up.
Applied Materials shrunk earnings per share by 17% over the last year. But over the longer term (5 years) earnings per share have increased by 26%.
A Limitation: P/E Ratios Ignore Debt and Cash In The Bank
It's important to note that the P/E ratio considers the market capitalization, not the enterprise value. So it won't reflect the advantage of cash, or disadvantage of debt. In theory, a company can lower its future P/E ratio by using cash or debt to invest in growth.
While growth expenditure doesn't always pay off, the point is that it is a good option to have; but one that the P/E ratio ignores.
How Does Applied Materials's Debt Impact Its P/E Ratio?
Net debt totals just 3.3% of Applied Materials's market cap. So it doesn't have as many options as it would with net cash, but its debt would not have much of an impact on its P/E ratio.
The Verdict On Applied Materials's P/E Ratio
Applied Materials has a P/E of 14.8. That's higher than the average in its market, which is 13.3. With modest debt but no EPS growth in the last year, it's fair to say the P/E implies some optimism about future earnings, from the market. What can be absolutely certain is that the market has become significantly less optimistic about Applied Materials over the last month, with the P/E ratio falling from 21.4 back then to 14.8 today. For those who don't like to trade against momentum, that could be a warning sign, but a contrarian investor might want to take a closer look.
When the market is wrong about a stock, it gives savvy investors an opportunity. As value investor Benjamin Graham famously said, 'In the short run, the market is a voting machine but in the long run, it is a weighing machine. So this free visual report on analyst forecasts could hold the key to an excellent investment decision.
But note: Applied Materials may not be the best stock to buy. So take a peek at this free list of interesting companies with strong recent earnings growth (and a P/E ratio below 20).
If you spot an error that warrants correction, please contact the editor at editorial-team@simplywallst.com. This article by Simply Wall St is general in nature. It does not constitute a recommendation to buy or sell any stock, and does not take account of your objectives, or your financial situation. Simply Wall St has no position in the stocks mentioned.
We aim to bring you long-term focused research analysis driven by fundamental data. Note that our analysis may not factor in the latest price-sensitive company announcements or qualitative material. Thank you for reading.
About NasdaqGS:AMAT
Applied Materials
Provides materials engineering solutions, equipment, services, and software to the semiconductor and related industries in the United States, China, Korea, Taiwan, Japan, Southeast Asia, Europe, and internationally.
Outstanding track record with flawless balance sheet.
Similar Companies
Market Insights


Advertisement
Weekly Picks
CE


Ceazar on Sparc AI ·
When GPS fails: this small cap is fixing a $54B drone problem
Fair Value:US$3.8756.3% undervalued
12 followersusers have followed this narrative
0 commentsusers have commented on this narrative
3 likesusers have liked this narrative
BL


BlackGoat on IREN ·
IREN's Bold Moves in Sustainable Bitcoin Mining & AI Data Centers
Fair Value:US$71.4852.5% undervalued
210 followersusers have followed this narrative
6 commentsusers have commented on this narrative
32 likesusers have liked this narrative
HE


HedgeY on Arm Holdings ·
The Architecture Layer of AI Computing - But Priced Like the Future Already Arrived?
Fair Value:US$43043.1% undervalued
13 followersusers have followed this narrative
1 commentusers have commented on this narrative
3 likesusers have liked this narrative
HI


Hidden_Rock_Capital on Fiserv ·
Temporary "perfect storm" leads to opportunity to buy financial services leader for less than 5x long-term earnings
Fair Value:US$119.9954.8% undervalued
20 followersusers have followed this narrative
0 commentsusers have commented on this narrative
8 likesusers have liked this narrative
Recently Updated Narratives
ON

Ontological on Lotus Technology ·
Lotus Tech, Finloop and FOMO Pay Collaborate to Explore Vehicle Tokenization
Fair Value:US$2.462.9% undervalued
1 followerusers have followed this narrative
1 commentusers have commented on this narrative
0 likesusers have liked this narrative
NE

newsfinder11221 on Robo.ai ·
Robo.ai (NASDAQ: AIIO): Building the Infrastructure Behind the AI Revolution
Fair Value:US$539.0% undervalued
1 followerusers have followed this narrative
3 commentsusers have commented on this narrative
0 likesusers have liked this narrative
EU


European_Hidden_Gem_Stocks on MINT Société anonyme ·
Mint SA: A French Micro-Cap Energy Retailer Worth Watching
Fair Value:€1153.1% undervalued
1 followerusers have followed this narrative
0 commentsusers have commented on this narrative
0 likesusers have liked this narrative
Popular Narratives
CU

CubanEros on Microsoft ·
A wonderful business at reasonable price.
Fair Value:US$419.916.3% undervalued
90 followersusers have followed this narrative
0 commentsusers have commented on this narrative
6 likesusers have liked this narrative
OS


oscargarcia on NVIDIA ·
The company that went from selling GPUs to gamers to becoming the AI arms dealer of the 21st century.
Fair Value:US$28029.6% undervalued
202 followersusers have followed this narrative
9 commentsusers have commented on this narrative
15 likesusers have liked this narrative
BE

benjamin_lvieq on PayPal Holdings ·
PayPal: PayPal Doesn't Need to Grow – It Needs to Stop Falling – A Mispriced Cash Machine With a Cannibal Buyback
Fair Value:US$6510.3% undervalued
73 followersusers have followed this narrative
2 commentsusers have commented on this narrative
11 likesusers have liked this narrative
Trending Discussion
BL

Blegells on Terra Balcanica Resources ·
⏫42X THE AVERAGE DAILY TRADING VOLUME TODAY, JULY 28 🐂🐂🐂 FORTY-TWO!
1
|0
DE

derek_3wsdg on Teladoc Health ·
You’ve overlooked the activist investor factor. Travis Cocke’s Voss has announced 5% ownership through a 13G filing. They’ve added to that 5% since, and in doing so, have created a structural trap door for 27.42 Million Shares actively sold short. Chuck will announce lots of positives on July 29 but it’s what Voss announces shortly after that will rock the overextended Teledoc shorts. The Walmart partnership is the tip of the iceberg. The market is missing the sheer regulatory and enterprise friction of modern corporate healthcare. Teladoc isn't a "consumer app"; it is the primary digital infrastructure integrated directly into the legacy backends of Tier-1 insurance companies and fortune 500 employers, covering 105 million+ lives. Teladoc is acting as the digital top-of-funnel engine for the world's largest retailer. If Voss pushes the narrative that Teladoc is effectively the outsourced digital brain of Walmart's entire healthcare footprint, the fair value shifts from a basic health multiple to an enterprise distribution premium. Additionally , we are in a structural gold rush for high-quality, legally compliant, longitudinal medical data to train vertical healthcare AI models. Large technology hyperscalers and pharmaceutical giants cannot simply scrape the internet for this; they need structured clinical inputs. Teladoc sits on one of the largest de-identified virtual medical datasets on earth. From the activist playbook , we’ll see Voss demand the immediate creation of a Data & Diagnostics Licensing Division, transforming a legacy liability into an incredibly high-margin, pure-software data asset that requires zero human clinician hours to scale. Chuck is doing great work and deserves credi5 for the Teledoc turnaround but it will be Travis Cocke who will be responsible for a share price way beyond your $15 valuation.
1
|0