Stock Analysis

David Iben put it well when he said, 'Volatility is not a risk we care about. What we care about is avoiding the permanent loss of capital.' So it seems the smart money knows that debt - which is usually involved in bankruptcies - is a very important factor, when you assess how risky a company is. As with many other companies GRP Limited (NSE:GRPLTD) makes use of debt. But the more important question is: how much risk is that debt creating?
When Is Debt Dangerous?
Debt and other liabilities become risky for a business when it cannot easily fulfill those obligations, either with free cash flow or by raising capital at an attractive price. Ultimately, if the company can't fulfill its legal obligations to repay debt, shareholders could walk away with nothing. However, a more usual (but still expensive) situation is where a company must dilute shareholders at a cheap share price simply to get debt under control. Of course, plenty of companies use debt to fund growth, without any negative consequences. When we think about a company's use of debt, we first look at cash and debt together.
See our latest analysis for GRP
What Is GRP's Net Debt?
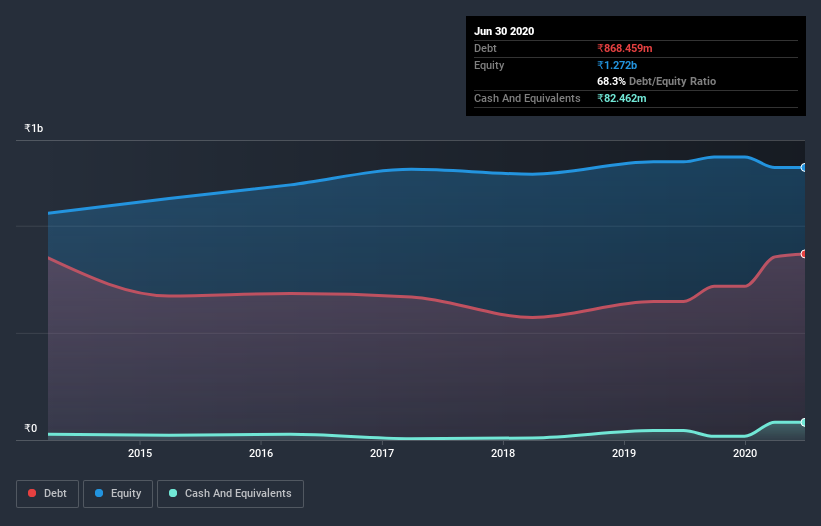
You can click the graphic below for the historical numbers, but it shows that as of March 2020 GRP had ₹854.6m of debt, an increase on ₹646.3m, over one year. However, it does have ₹82.5m in cash offsetting this, leading to net debt of about ₹772.1m.
A Look At GRP's Liabilities
We can see from the most recent balance sheet that GRP had liabilities of ₹1.13b falling due within a year, and liabilities of ₹288.0m due beyond that. Offsetting these obligations, it had cash of ₹82.5m as well as receivables valued at ₹672.9m due within 12 months. So it has liabilities totalling ₹661.1m more than its cash and near-term receivables, combined.
This deficit is considerable relative to its market capitalization of ₹977.2m, so it does suggest shareholders should keep an eye on GRP's use of debt. Should its lenders demand that it shore up the balance sheet, shareholders would likely face severe dilution. There's no doubt that we learn most about debt from the balance sheet. But it is GRP's earnings that will influence how the balance sheet holds up in the future. So when considering debt, it's definitely worth looking at the earnings trend. Click here for an interactive snapshot.
Over 12 months, GRP made a loss at the EBIT level, and saw its revenue drop to ₹2.9b, which is a fall of 21%. To be frank that doesn't bode well.
Caveat Emptor
While GRP's falling revenue is about as heartwarming as a wet blanket, arguably its earnings before interest and tax (EBIT) loss is even less appealing. To be specific the EBIT loss came in at ₹85.1m. Considering that alongside the liabilities mentioned above does not give us much confidence that company should be using so much debt. So we think its balance sheet is a little strained, though not beyond repair. Another cause for caution is that is bled ₹46.5m in negative free cash flow over the last twelve months. So to be blunt we think it is risky. When analysing debt levels, the balance sheet is the obvious place to start. But ultimately, every company can contain risks that exist outside of the balance sheet. Case in point: We've spotted 4 warning signs for GRP you should be aware of, and 2 of them shouldn't be ignored.
If you're interested in investing in businesses that can grow profits without the burden of debt, then check out this free list of growing businesses that have net cash on the balance sheet.
If you’re looking to trade GRP, open an account with the lowest-cost* platform trusted by professionals, Interactive Brokers. Their clients from over 200 countries and territories trade stocks, options, futures, forex, bonds and funds worldwide from a single integrated account. Promoted
Valuation is complex, but we're helping make it simple.
Find out whether GRP is potentially over or undervalued by checking out our comprehensive analysis, which includes fair value estimates, risks and warnings, dividends, insider transactions and financial health.
View the Free AnalysisThis article by Simply Wall St is general in nature. It does not constitute a recommendation to buy or sell any stock, and does not take account of your objectives, or your financial situation. We aim to bring you long-term focused analysis driven by fundamental data. Note that our analysis may not factor in the latest price-sensitive company announcements or qualitative material. Simply Wall St has no position in any stocks mentioned.
*Interactive Brokers Rated Lowest Cost Broker by StockBrokers.com Annual Online Review 2020
Have feedback on this article? Concerned about the content? Get in touch with us directly. Alternatively, email editorial-team@simplywallst.com.
About NSEI:GRPLTD
GRP
Manufactures and sells reclaimed rubber products for tire and non-tire rubber goods in India and internationally.
Proven track record with adequate balance sheet.
