
Advertisement
- United States
- /
- Wireless Telecom
- /
- NasdaqGS:TIGO
After Leaping 26% Millicom International Cellular S.A. (NASDAQ:TIGO) Shares Are Not Flying Under The Radar

Millicom International Cellular S.A. (NASDAQ:TIGO) shareholders would be excited to see that the share price has had a great month, posting a 26% gain and recovering from prior weakness. Unfortunately, despite the strong performance over the last month, the full year gain of 7.7% isn't as attractive.
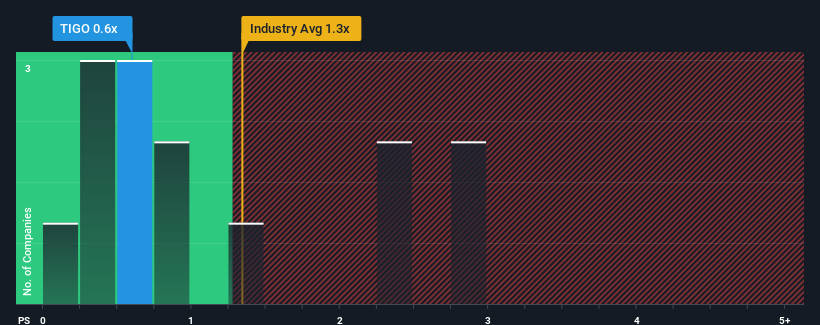
Even after such a large jump in price, you could still be forgiven for feeling indifferent about Millicom International Cellular's P/S ratio of 0.6x, since the median price-to-sales (or "P/S") ratio for the Wireless Telecom industry in the United States is about the same. Although, it's not wise to simply ignore the P/S without explanation as investors may be disregarding a distinct opportunity or a costly mistake.
See our latest analysis for Millicom International Cellular
What Does Millicom International Cellular's Recent Performance Look Like?
Millicom International Cellular certainly has been doing a good job lately as its revenue growth has been positive while most other companies have been seeing their revenue go backwards. Perhaps the market is expecting its current strong performance to taper off in accordance to the rest of the industry, which has kept the P/S contained. Those who are bullish on Millicom International Cellular will be hoping that this isn't the case, so that they can pick up the stock at a slightly lower valuation.
If you'd like to see what analysts are forecasting going forward, you should check out our free report on Millicom International Cellular.Do Revenue Forecasts Match The P/S Ratio?
The only time you'd be comfortable seeing a P/S like Millicom International Cellular's is when the company's growth is tracking the industry closely.
Retrospectively, the last year delivered virtually the same number to the company's top line as the year before. However, a few strong years before that means that it was still able to grow revenue by an impressive 49% in total over the last three years. So while the company has done a solid job in the past, it's somewhat concerning to see revenue growth decline as much as it has.
Turning to the outlook, the next three years should generate growth of 3.0% per year as estimated by the nine analysts watching the company. With the industry predicted to deliver 3.3% growth per year, the company is positioned for a comparable revenue result.
In light of this, it's understandable that Millicom International Cellular's P/S sits in line with the majority of other companies. It seems most investors are expecting to see average future growth and are only willing to pay a moderate amount for the stock.
What Does Millicom International Cellular's P/S Mean For Investors?
Millicom International Cellular's stock has a lot of momentum behind it lately, which has brought its P/S level with the rest of the industry. We'd say the price-to-sales ratio's power isn't primarily as a valuation instrument but rather to gauge current investor sentiment and future expectations.
A Millicom International Cellular's P/S seems about right to us given the knowledge that analysts are forecasting a revenue outlook that is similar to the Wireless Telecom industry. Right now shareholders are comfortable with the P/S as they are quite confident future revenue won't throw up any surprises. Unless these conditions change, they will continue to support the share price at these levels.
Having said that, be aware Millicom International Cellular is showing 1 warning sign in our investment analysis, you should know about.
Of course, profitable companies with a history of great earnings growth are generally safer bets. So you may wish to see this free collection of other companies that have reasonable P/E ratios and have grown earnings strongly.
New: Manage All Your Stock Portfolios in One Place
We've created the ultimate portfolio companion for stock investors, and it's free.
• Connect an unlimited number of Portfolios and see your total in one currency
• Be alerted to new Warning Signs or Risks via email or mobile
• Track the Fair Value of your stocks
Have feedback on this article? Concerned about the content? Get in touch with us directly. Alternatively, email editorial-team (at) simplywallst.com.
This article by Simply Wall St is general in nature. We provide commentary based on historical data and analyst forecasts only using an unbiased methodology and our articles are not intended to be financial advice. It does not constitute a recommendation to buy or sell any stock, and does not take account of your objectives, or your financial situation. We aim to bring you long-term focused analysis driven by fundamental data. Note that our analysis may not factor in the latest price-sensitive company announcements or qualitative material. Simply Wall St has no position in any stocks mentioned.
About NasdaqGS:TIGO
Millicom International Cellular
Provides cable and mobile services in Latin America.
Solid track record average dividend payer.
Similar Companies
Market Insights


Advertisement
Community Narratives
MicroStrategy: Volatile Gamble or Golden Opportunity?
Fair Value US$663.00|31.2% undervalued
BL
Community Contributor
Emerging Markets and Debt Reduction Will Propel Bath & Body Works Forward
Fair Value US$40.73|24.4% undervalued
ZW
Community Contributor
An amazing opportunity to potentially get a 100 bagger
Fair Value US$10.00|13.5% overvalued
DA
Community Contributor