Stock Analysis
- United States
- /
- Software
- /
- NYSE:AI
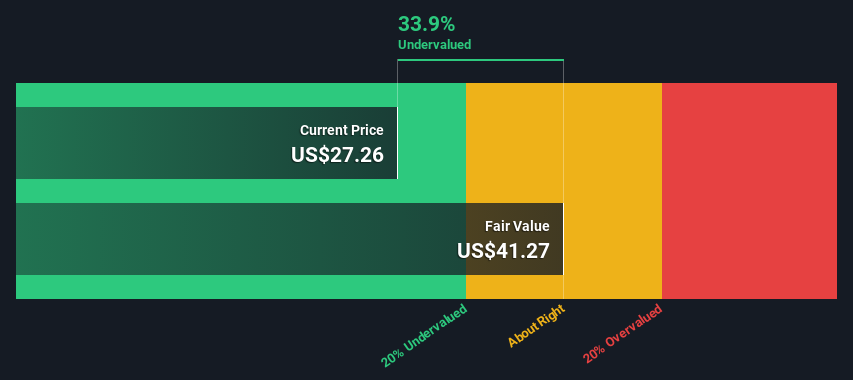
Is C3.ai, Inc. (NYSE:AI) Trading At A 34% Discount?

Key Insights
- The projected fair value for C3.ai is US$41.27 based on 2 Stage Free Cash Flow to Equity
- C3.ai's US$27.26 share price signals that it might be 34% undervalued
- The US$28.98 analyst price target for AI is 30% less than our estimate of fair value
In this article we are going to estimate the intrinsic value of C3.ai, Inc. (NYSE:AI) by taking the expected future cash flows and discounting them to today's value. We will take advantage of the Discounted Cash Flow (DCF) model for this purpose. Believe it or not, it's not too difficult to follow, as you'll see from our example!
We generally believe that a company's value is the present value of all of the cash it will generate in the future. However, a DCF is just one valuation metric among many, and it is not without flaws. For those who are keen learners of equity analysis, the Simply Wall St analysis model here may be something of interest to you.
See our latest analysis for C3.ai
Is C3.ai Fairly Valued?
We use what is known as a 2-stage model, which simply means we have two different periods of growth rates for the company's cash flows. Generally the first stage is higher growth, and the second stage is a lower growth phase. To begin with, we have to get estimates of the next ten years of cash flows. Where possible we use analyst estimates, but when these aren't available we extrapolate the previous free cash flow (FCF) from the last estimate or reported value. We assume companies with shrinking free cash flow will slow their rate of shrinkage, and that companies with growing free cash flow will see their growth rate slow, over this period. We do this to reflect that growth tends to slow more in the early years than it does in later years.
Generally we assume that a dollar today is more valuable than a dollar in the future, and so the sum of these future cash flows is then discounted to today's value:
10-year free cash flow (FCF) estimate
| 2024 | 2025 | 2026 | 2027 | 2028 | 2029 | 2030 | 2031 | 2032 | 2033 | |
| Levered FCF ($, Millions) | -US$89.2m | -US$19.0m | US$43.1m | US$78.8m | US$125.1m | US$177.3m | US$230.4m | US$280.2m | US$324.6m | US$362.8m |
| Growth Rate Estimate Source | Analyst x7 | Analyst x7 | Analyst x5 | Est @ 82.86% | Est @ 58.69% | Est @ 41.77% | Est @ 29.93% | Est @ 21.63% | Est @ 15.83% | Est @ 11.77% |
| Present Value ($, Millions) Discounted @ 6.9% | -US$83.4 | -US$16.6 | US$35.3 | US$60.4 | US$89.7 | US$119 | US$145 | US$165 | US$178 | US$187 |
("Est" = FCF growth rate estimated by Simply Wall St)
Present Value of 10-year Cash Flow (PVCF) = US$878m
We now need to calculate the Terminal Value, which accounts for all the future cash flows after this ten year period. The Gordon Growth formula is used to calculate Terminal Value at a future annual growth rate equal to the 5-year average of the 10-year government bond yield of 2.3%. We discount the terminal cash flows to today's value at a cost of equity of 6.9%.
Terminal Value (TV)= FCF2033 × (1 + g) ÷ (r – g) = US$363m× (1 + 2.3%) ÷ (6.9%– 2.3%) = US$8.1b
Present Value of Terminal Value (PVTV)= TV / (1 + r)10= US$8.1b÷ ( 1 + 6.9%)10= US$4.2b
The total value, or equity value, is then the sum of the present value of the future cash flows, which in this case is US$5.0b. To get the intrinsic value per share, we divide this by the total number of shares outstanding. Relative to the current share price of US$27.3, the company appears quite good value at a 34% discount to where the stock price trades currently. The assumptions in any calculation have a big impact on the valuation, so it is better to view this as a rough estimate, not precise down to the last cent.
Important Assumptions
The calculation above is very dependent on two assumptions. The first is the discount rate and the other is the cash flows. Part of investing is coming up with your own evaluation of a company's future performance, so try the calculation yourself and check your own assumptions. The DCF also does not consider the possible cyclicality of an industry, or a company's future capital requirements, so it does not give a full picture of a company's potential performance. Given that we are looking at C3.ai as potential shareholders, the cost of equity is used as the discount rate, rather than the cost of capital (or weighted average cost of capital, WACC) which accounts for debt. In this calculation we've used 6.9%, which is based on a levered beta of 0.998. Beta is a measure of a stock's volatility, compared to the market as a whole. We get our beta from the industry average beta of globally comparable companies, with an imposed limit between 0.8 and 2.0, which is a reasonable range for a stable business.
SWOT Analysis for C3.ai
- Currently debt free.
- Shareholders have been diluted in the past year.
- Has sufficient cash runway for more than 3 years based on current free cash flows.
- Trading below our estimate of fair value by more than 20%.
- Not expected to become profitable over the next 3 years.
Looking Ahead:
Although the valuation of a company is important, it shouldn't be the only metric you look at when researching a company. The DCF model is not a perfect stock valuation tool. Rather it should be seen as a guide to "what assumptions need to be true for this stock to be under/overvalued?" For instance, if the terminal value growth rate is adjusted slightly, it can dramatically alter the overall result. What is the reason for the share price sitting below the intrinsic value? For C3.ai, there are three relevant elements you should assess:
- Risks: You should be aware of the 4 warning signs for C3.ai (1 shouldn't be ignored!) we've uncovered before considering an investment in the company.
- Future Earnings: How does AI's growth rate compare to its peers and the wider market? Dig deeper into the analyst consensus number for the upcoming years by interacting with our free analyst growth expectation chart.
- Other High Quality Alternatives: Do you like a good all-rounder? Explore our interactive list of high quality stocks to get an idea of what else is out there you may be missing!
PS. The Simply Wall St app conducts a discounted cash flow valuation for every stock on the NYSE every day. If you want to find the calculation for other stocks just search here.
Valuation is complex, but we're helping make it simple.
Find out whether C3.ai is potentially over or undervalued by checking out our comprehensive analysis, which includes fair value estimates, risks and warnings, dividends, insider transactions and financial health.
View the Free AnalysisHave feedback on this article? Concerned about the content? Get in touch with us directly. Alternatively, email editorial-team (at) simplywallst.com.
This article by Simply Wall St is general in nature. We provide commentary based on historical data and analyst forecasts only using an unbiased methodology and our articles are not intended to be financial advice. It does not constitute a recommendation to buy or sell any stock, and does not take account of your objectives, or your financial situation. We aim to bring you long-term focused analysis driven by fundamental data. Note that our analysis may not factor in the latest price-sensitive company announcements or qualitative material. Simply Wall St has no position in any stocks mentioned.
About NYSE:AI
C3.ai
C3.ai, Inc. operates as an enterprise artificial intelligence (AI) software company in North America, Europe, the Middle East, Africa, the Asia Pacific, and internationally.
Excellent balance sheet and slightly overvalued.

