Stock Analysis
- United Kingdom
- /
- Pharma
- /
- LSE:GSK
GSK's (LON:GSK) one-year earnings growth trails the shareholder returns
These days it's easy to simply buy an index fund, and your returns should (roughly) match the market. But investors can boost returns by picking market-beating companies to own shares in. To wit, the GSK plc (LON:GSK) share price is 20% higher than it was a year ago, much better than the market return of around 2.7% (not including dividends) in the same period. So that should have shareholders smiling. However, the longer term returns haven't been so impressive, with the stock up just 5.9% in the last three years.
The past week has proven to be lucrative for GSK investors, so let's see if fundamentals drove the company's one-year performance.
See our latest analysis for GSK
There is no denying that markets are sometimes efficient, but prices do not always reflect underlying business performance. One imperfect but simple way to consider how the market perception of a company has shifted is to compare the change in the earnings per share (EPS) with the share price movement.
GSK was able to grow EPS by 9.8% in the last twelve months. This EPS growth is significantly lower than the 20% increase in the share price. So it's fair to assume the market has a higher opinion of the business than it a year ago.
The company's earnings per share (over time) is depicted in the image below (click to see the exact numbers).
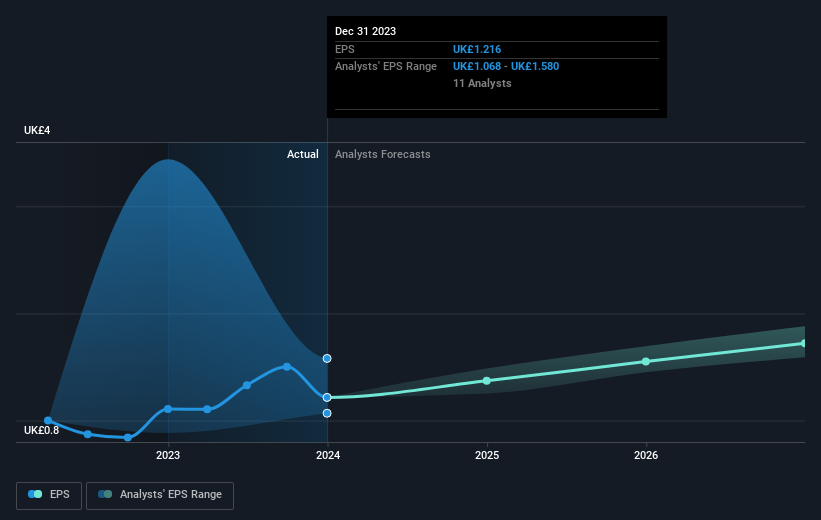
It's good to see that there was some significant insider buying in the last three months. That's a positive. That said, we think earnings and revenue growth trends are even more important factors to consider. Dive deeper into the earnings by checking this interactive graph of GSK's earnings, revenue and cash flow.
What About Dividends?
When looking at investment returns, it is important to consider the difference between total shareholder return (TSR) and share price return. The TSR incorporates the value of any spin-offs or discounted capital raisings, along with any dividends, based on the assumption that the dividends are reinvested. So for companies that pay a generous dividend, the TSR is often a lot higher than the share price return. As it happens, GSK's TSR for the last 1 year was 25%, which exceeds the share price return mentioned earlier. And there's no prize for guessing that the dividend payments largely explain the divergence!
A Different Perspective
It's good to see that GSK has rewarded shareholders with a total shareholder return of 25% in the last twelve months. And that does include the dividend. That's better than the annualised return of 6% over half a decade, implying that the company is doing better recently. Given the share price momentum remains strong, it might be worth taking a closer look at the stock, lest you miss an opportunity. It's always interesting to track share price performance over the longer term. But to understand GSK better, we need to consider many other factors. Consider risks, for instance. Every company has them, and we've spotted 3 warning signs for GSK you should know about.
If you like to buy stocks alongside management, then you might just love this free list of companies. (Hint: insiders have been buying them).
Please note, the market returns quoted in this article reflect the market weighted average returns of stocks that currently trade on British exchanges.
Valuation is complex, but we're helping make it simple.
Find out whether GSK is potentially over or undervalued by checking out our comprehensive analysis, which includes fair value estimates, risks and warnings, dividends, insider transactions and financial health.
View the Free AnalysisHave feedback on this article? Concerned about the content? Get in touch with us directly. Alternatively, email editorial-team (at) simplywallst.com.
This article by Simply Wall St is general in nature. We provide commentary based on historical data and analyst forecasts only using an unbiased methodology and our articles are not intended to be financial advice. It does not constitute a recommendation to buy or sell any stock, and does not take account of your objectives, or your financial situation. We aim to bring you long-term focused analysis driven by fundamental data. Note that our analysis may not factor in the latest price-sensitive company announcements or qualitative material. Simply Wall St has no position in any stocks mentioned.
About LSE:GSK
GSK
GSK plc, together with its subsidiaries, engages in the research, development, and manufacture of vaccines, and specialty and general medicines to prevent and treat disease in the United Kingdom, the United States, and internationally.
Undervalued with proven track record.

