
Advertisement
- United States
- /
- Gas Utilities
- /
- NYSE:SR
Spire (NYSE:SR) Has A Somewhat Strained Balance Sheet
David Iben put it well when he said, 'Volatility is not a risk we care about. What we care about is avoiding the permanent loss of capital. So it might be obvious that you need to consider debt, when you think about how risky any given stock is, because too much debt can sink a company. Importantly, Spire Inc. (NYSE:SR) does carry debt. But the real question is whether this debt is making the company risky.
When Is Debt Dangerous?
Debt assists a business until the business has trouble paying it off, either with new capital or with free cash flow. If things get really bad, the lenders can take control of the business. However, a more common (but still painful) scenario is that it has to raise new equity capital at a low price, thus permanently diluting shareholders. Of course, debt can be an important tool in businesses, particularly capital heavy businesses. The first step when considering a company's debt levels is to consider its cash and debt together.
See our latest analysis for Spire
What Is Spire's Net Debt?
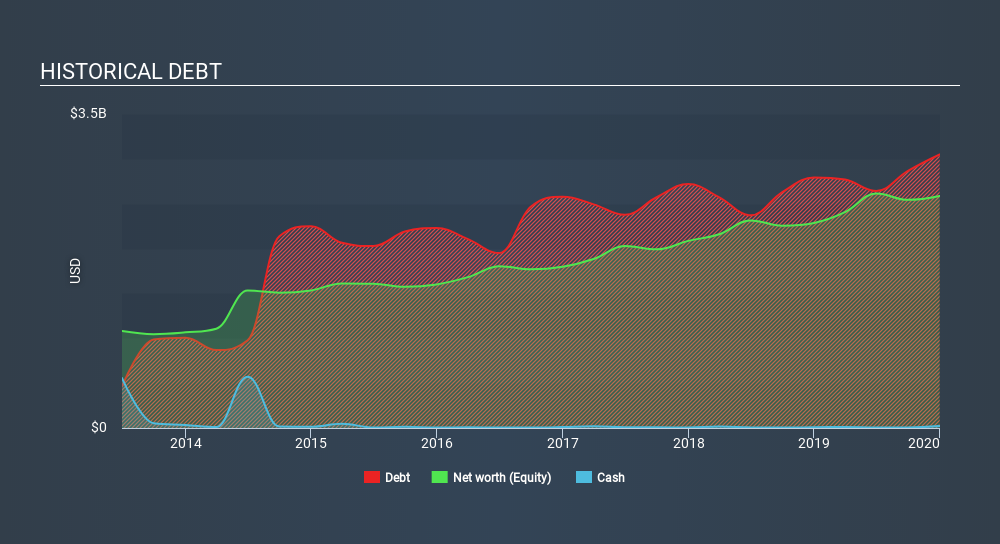
The image below, which you can click on for greater detail, shows that at December 2019 Spire had debt of US$3.05b, up from US$2.79b in one year. Net debt is about the same, since the it doesn't have much cash.
A Look At Spire's Liabilities
We can see from the most recent balance sheet that Spire had liabilities of US$1.25b falling due within a year, and liabilities of US$4.12b due beyond that. On the other hand, it had cash of US$21.5m and US$457.9m worth of receivables due within a year. So its liabilities total US$4.90b more than the combination of its cash and short-term receivables.
When you consider that this deficiency exceeds the company's US$3.84b market capitalization, you might well be inclined to review the balance sheet intently. In the scenario where the company had to clean up its balance sheet quickly, it seems likely shareholders would suffer extensive dilution.
In order to size up a company's debt relative to its earnings, we calculate its net debt divided by its earnings before interest, tax, depreciation, and amortization (EBITDA) and its earnings before interest and tax (EBIT) divided by its interest expense (its interest cover). This way, we consider both the absolute quantum of the debt, as well as the interest rates paid on it.
Spire has a rather high debt to EBITDA ratio of 6.1 which suggests a meaningful debt load. However, its interest coverage of 2.9 is reasonably strong, which is a good sign. Fortunately, Spire grew its EBIT by 9.9% in the last year, slowly shrinking its debt relative to earnings. The balance sheet is clearly the area to focus on when you are analysing debt. But it is future earnings, more than anything, that will determine Spire's ability to maintain a healthy balance sheet going forward. So if you're focused on the future you can check out this free report showing analyst profit forecasts.
But our final consideration is also important, because a company cannot pay debt with paper profits; it needs cold hard cash. So we always check how much of that EBIT is translated into free cash flow. Over the last three years, Spire saw substantial negative free cash flow, in total. While that may be a result of expenditure for growth, it does make the debt far more risky.
Our View
To be frank both Spire's net debt to EBITDA and its track record of converting EBIT to free cash flow make us rather uncomfortable with its debt levels. But on the bright side, its EBIT growth rate is a good sign, and makes us more optimistic. We should also note that Gas Utilities industry companies like Spire commonly do use debt without problems. Overall, it seems to us that Spire's balance sheet is really quite a risk to the business. So we're almost as wary of this stock as a hungry kitten is about falling into its owner's fish pond: once bitten, twice shy, as they say. When analysing debt levels, the balance sheet is the obvious place to start. But ultimately, every company can contain risks that exist outside of the balance sheet. Be aware that Spire is showing 2 warning signs in our investment analysis , and 1 of those shouldn't be ignored...
When all is said and done, sometimes its easier to focus on companies that don't even need debt. Readers can access a list of growth stocks with zero net debt 100% free, right now.
If you spot an error that warrants correction, please contact the editor at editorial-team@simplywallst.com. This article by Simply Wall St is general in nature. It does not constitute a recommendation to buy or sell any stock, and does not take account of your objectives, or your financial situation. Simply Wall St has no position in the stocks mentioned.
We aim to bring you long-term focused research analysis driven by fundamental data. Note that our analysis may not factor in the latest price-sensitive company announcements or qualitative material. Thank you for reading.
M

The Foxhole
Everyone's watching the oil price. The harder problem is the gas that can't take a detour.
148
R
Rob_Curious
What I've learnt in the last six months is that fuel supply disruption is a real portfolio risk, and one of the better hedges is a small allocation to shipping. Though it's insane how much these have run up this year.
f
frank_ub3n0
Spot on. Shipping and logistics is much larger constraint for gas than oil. Sorry to break it to you. No quick fixes for that.
 Mitchell Lawler
Market Insights
What happens to energy stocks as the fix gets built?

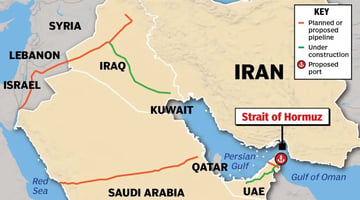
Conflict around the Strait of Hormuz has led investors to oil and tankers. The trouble is, the antidote to the chokepoints is already being built, and it may not reward the same energy stocks.
32
About NYSE:SR
Spire
Engages in the purchase, retail distribution, and sale of natural gas to residential, commercial, industrial, and other end-users of natural gas in the United States.
Solid track record average dividend payer.
Similar Companies
Market Insights


Advertisement
Weekly Picks
CE


Ceazar on Sparc AI ·
When GPS fails: this small cap is fixing a $54B drone problem
Fair Value:CA$5.2532.6% undervalued
208 followersusers have followed this narrative
0 commentsusers have commented on this narrative
31 likesusers have liked this narrative
CO


composite32 on Archrock ·
AI Needs Power. Power Needs Gas. Gas Needs Compression: The Archrock Investment Thesis
Fair Value:US$44.8829.7% undervalued
34 followersusers have followed this narrative
2 commentsusers have commented on this narrative
3 likesusers have liked this narrative
JO


John_Eric on Advanced Energy Industries ·
AEIS Is Firing on Every Cylinder. My Problem Is the Safety Factor.
Fair Value:US$567.8653.8% undervalued
21 followersusers have followed this narrative
0 commentsusers have commented on this narrative
7 likesusers have liked this narrative
IS

isidrohg on Lam Research ·
The Memory Shortage Is Lam's Order Book — Whether It Persists Or Resolves
Fair Value:US$423.8532.0% undervalued
25 followersusers have followed this narrative
0 commentsusers have commented on this narrative
7 likesusers have liked this narrative
Recently Updated Narratives
PU

Pubs on Omnia Holdings ·
Omnia Holdings Limited (XJSE:OMN)
Fair Value:R61.43101.0% overvalued
1 followerusers have followed this narrative
0 commentsusers have commented on this narrative
0 likesusers have liked this narrative
ES

Esteban on MSCI ·
MSCI 04-2026
Fair Value:US$422.630.8% overvalued
6 followersusers have followed this narrative
0 commentsusers have commented on this narrative
0 likesusers have liked this narrative
KA

KASHIF_RIAZ_ on Service Long March Tyres ·
SLM: Pakistan's radial-tyre import-substitution play, fairly valued near listing price
Fair Value:PK₨26.514.0% undervalued
1 followerusers have followed this narrative
0 commentsusers have commented on this narrative
0 likesusers have liked this narrative
Popular Narratives
AN


AnalystConsensusTarget on NVIDIA ·
NVDA: Expanding AI Demand Will Drive Major Data Center Investments Through 2026
Fair Value:US$302.8326.6% undervalued
1484 followersusers have followed this narrative
8 commentsusers have commented on this narrative
35 likesusers have liked this narrative
AN

AnalystConsensusTarget on Alphabet ·
GOOGL: AI Platform Expansion And Cloud Demand Will Support Durable Performance Amid Competitive Pressures
Fair Value:US$427.8918.3% undervalued
1646 followersusers have followed this narrative
0 commentsusers have commented on this narrative
19 likesusers have liked this narrative
AN

AnalystConsensusTarget on Amazon.com ·
AMZN: Acceleration In Cloud And AI Will Drive Margin Expansion Ahead
Fair Value:US$32722.4% undervalued
1662 followersusers have followed this narrative
1 commentusers have commented on this narrative
16 likesusers have liked this narrative
Trending Discussion


AN

anthony_x0j2w on Platform Group SE KGaA ·
Hello,(I am a shareholder).I spent the summer investigating in whatever I was able to find in the press, the trustee, or legal, and comparing it to FS Benner's declaration/transcripts:press: MM has a tendancy to use facts, modify them and turn them the way they want: 100% of their claims against TPG0 is traçable factually, 80% is flawed and interpreted. Example are numerous: 11M loans banks to be paid seems right, but it has not been an issue at all, it has been paid in full. (and it happens all the time in every business...); the previous HR becoming a financial director in the article herself being attacked by TPG on the legal side; the wrong address of curator (if truly announced by TPG).Trustee: according to my research (which can be incomplete) no communication to the Nordic trustee (hereby, bond holders) has been done on a, indebtedness (late payment) > 1M€, which is their obligation by contract (clause 14.d - https://corporate.the-platform-group.com/bond/) => this is a sign of a huge lie and fraud, or the sign that there is no indebtedness > 1M€ over the whole TPG group.Legal: still awaiting for an answer, probable that I won't get it.VALUATIONYou can spent hours working the fundamentals, if they're flawed...the thesis falls.Anyway, I always substracts the badwill (that I consider non-current - you have it in the CFS) & non-controlling interests from my valuation:Earnings ~22MFCF ~40M€The financial statements are not the issue here, we are more on an cheap option on the sincerity of the accounts that a real valuation. Unfortunately, these are unverifiable elements, hence the low price./!\ Careful:the accounts are consolidated and skip the subsidiaries issues...Careful with the business model: TPG0 is a financial holding that acquire subsidiaries, hold the debt, and has no operations. 100% of the Cash Flow comes from subs' dividends => it is a risk here, more a plumber risk than an operational one, but nevertheless...The auditor is too small, and managed by the same firm than before, with 140K€/year commission => it's too low, nobody external really reviewed what Benner and his team are doing internallycapital increase do not go through the CFS, but through change in equity AND equity in the BSIf the equity stays low too long, the WACC increase will be unbearable (I have a 30% global, with a 118% on equity): diluting is expensive => TPG machine can stay broken for a while.Most of the people I talk with never saw this, while this is ESSENTIAL to Benner's business model.SEVERAL EVENTS THAT COULD CHANGE:AEP is being audited by KPMG: if Benner plays the "we will propose KPMG to our shareholders BEOY", this can increase the trust in him significantly/KPMG (or other) to validate the 2026 IFRS accounts & having a word on HGB's: though still consolidated, at least we'll know...AEP being eventually acquired: while it carries a high integration risk due to its size, they talked about it so many times, that trust goes with it.Without this combination of event, the equity is doomed to stay at this level, IMO.Do not forget to also follow the bond: with TPG's announced safe harbor plan for buyback (25% of daily exchange), it is also interesting to check this illiquid and retail market: https://live.deutsche-boerse.com/bond/no0013256834-the-platform-group-ag-8-875-24-28?mic=XFRA
1
|0