Advertisement
- United Kingdom
- /
- Industrials
- /
- LSE:SMIN
Should You Buy Smiths Group plc (LON:SMIN) For Its Dividend?
Dividend paying stocks like Smiths Group plc (LON:SMIN) tend to be popular with investors, and for good reason - some research suggests a significant amount of all stock market returns come from reinvested dividends. Unfortunately, it's common for investors to be enticed in by the seemingly attractive yield, and lose money when the company has to cut its dividend payments.
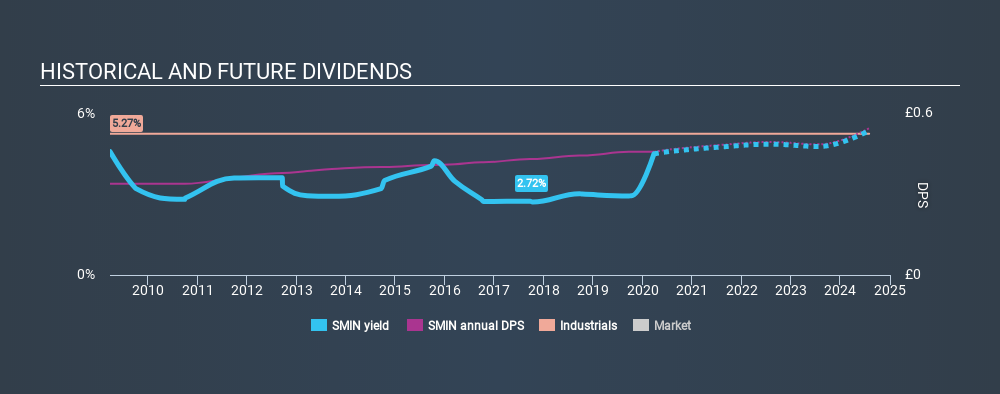
With Smiths Group yielding 4.5% and having paid a dividend for over 10 years, many investors likely find the company quite interesting. It would not be a surprise to discover that many investors buy it for the dividends. Remember that the recent share price drop will make Smiths Group's yield look higher, even though recent events might have impacted the company's prospects. Some simple analysis can offer a lot of insights when buying a company for its dividend, and we'll go through this below.
Explore this interactive chart for our latest analysis on Smiths Group!
Payout ratios
Companies (usually) pay dividends out of their earnings. If a company is paying more than it earns, the dividend might have to be cut. Comparing dividend payments to a company's net profit after tax is a simple way of reality-checking whether a dividend is sustainable. In the last year, Smiths Group paid out 130% of its profit as dividends. A payout ratio above 100% is definitely an item of concern, unless there are some other circumstances that would justify it.
Another important check we do is to see if the free cash flow generated is sufficient to pay the dividend. Smiths Group paid out 78% of its cash flow last year. This may be sustainable but it does not leave much of a buffer for unexpected circumstances. It's good to see that while Smiths Group's dividends were not covered by profits, at least they are affordable from a cash perspective. If executives were to continue paying more in dividends than the company reported in profits, we'd view this as a warning sign. Extraordinarily few companies are capable of persistently paying a dividend that is greater than their profits.
Is Smiths Group's Balance Sheet Risky?
As Smiths Group's dividend was not well covered by earnings, we need to check its balance sheet for signs of financial distress. A rough way to check this is with these two simple ratios: a) net debt divided by EBITDA (earnings before interest, tax, depreciation and amortisation), and b) net interest cover. Net debt to EBITDA measures total debt load relative to company earnings (lower = less debt), while net interest cover measures the ability to pay interest on the debt (higher = greater ability to pay interest costs). Smiths Group has net debt of 2.45 times its EBITDA. Using debt can accelerate business growth, but also increases the risks.
We calculated its interest cover by measuring its earnings before interest and tax (EBIT), and dividing this by the company's net interest expense. Net interest cover of 7.78 times its interest expense appears reasonable for Smiths Group, although we're conscious that even high interest cover doesn't make a company bulletproof.
Consider getting our latest analysis on Smiths Group's financial position here.
Dividend Volatility
Before buying a stock for its income, we want to see if the dividends have been stable in the past, and if the company has a track record of maintaining its dividend. For the purpose of this article, we only scrutinise the last decade of Smiths Group's dividend payments. During this period the dividend has been stable, which could imply the business could have relatively consistent earnings power. During the past ten-year period, the first annual payment was UK£0.34 in 2010, compared to UK£0.46 last year. This works out to be a compound annual growth rate (CAGR) of approximately 3.0% a year over that time.
While the consistency in the dividend payments is impressive, we think the relatively slow rate of growth is unappealing.
Dividend Growth Potential
Dividend payments have been consistent over the past few years, but we should always check if earnings per share (EPS) are growing, as this will help maintain the purchasing power of the dividend. It's not great to see that Smiths Group's have fallen at approximately 9.8% over the past five years. Declining earnings per share over a number of years is not a great sign for the dividend investor. Without some improvement, this does not bode well for the long term value of a company's dividend.
Conclusion
Dividend investors should always want to know if a) a company's dividends are affordable, b) if there is a track record of consistent payments, and c) if the dividend is capable of growing. We're not keen on the fact that Smiths Group paid out such a high percentage of its income, although its cashflow is in better shape. Moreover, earnings have been shrinking. While the dividends have been fairly steady, we'd wonder for how much longer this will be sustainable if earnings continue to decline. With this information in mind, we think Smiths Group may not be an ideal dividend stock.
Market movements attest to how highly valued a consistent dividend policy is to one to which is more unpredictable. Still, investors need to consider a host of other factors, apart from dividend payments, when analysing a company. Taking the debate a bit further, we've identified 3 warning signs for Smiths Group that investors need to be conscious of moving forward.
If you are a dividend investor, you might also want to look at our curated list of dividend stocks yielding above 3%.
If you spot an error that warrants correction, please contact the editor at editorial-team@simplywallst.com. This article by Simply Wall St is general in nature. It does not constitute a recommendation to buy or sell any stock, and does not take account of your objectives, or your financial situation. Simply Wall St has no position in the stocks mentioned.
We aim to bring you long-term focused research analysis driven by fundamental data. Note that our analysis may not factor in the latest price-sensitive company announcements or qualitative material. Thank you for reading.
About LSE:SMIN
Smiths Group
Operates as an industrial technology company in Americas, Europe, the Asia Pacific, and internationally.
Adequate balance sheet second-rate dividend payer.
Similar Companies
Market Insights


Advertisement
Weekly Picks
CE


Ceazar on Sparc AI ·
When GPS fails: this small cap is fixing a $54B drone problem
Fair Value:CA$5.2552.0% undervalued
129 followersusers have followed this narrative
0 commentsusers have commented on this narrative
25 likesusers have liked this narrative
BL


BlackGoat on IREN ·
IREN's Bold Moves in Sustainable Bitcoin Mining & AI Data Centers
Fair Value:US$71.4848.5% undervalued
226 followersusers have followed this narrative
9 commentsusers have commented on this narrative
33 likesusers have liked this narrative
HE


HedgeY on Arm Holdings ·
The Architecture Layer of AI Computing - But Priced Like the Future Already Arrived?
Fair Value:US$43044.3% undervalued
27 followersusers have followed this narrative
1 commentusers have commented on this narrative
7 likesusers have liked this narrative
HI


Hidden_Rock_Capital on Fiserv ·
Temporary "perfect storm" leads to opportunity to buy financial services leader for less than 5x long-term earnings
Fair Value:US$119.9955.0% undervalued
36 followersusers have followed this narrative
1 commentusers have commented on this narrative
10 likesusers have liked this narrative
Recently Updated Narratives
IV

Ivoed on ASML Holding ·
ASML’s China Sell-Off Looks Overdone, Yet The Shares Are Not Cheap
Fair Value:€1.78k19.4% undervalued
1 followerusers have followed this narrative
0 commentsusers have commented on this narrative
0 likesusers have liked this narrative
BI

Bigd on Volatus Aerospace ·
Strong buy
Fair Value:CA$1.0553.8% undervalued
15 followersusers have followed this narrative
1 commentusers have commented on this narrative
0 likesusers have liked this narrative
BO

Bourne on ResMed ·
ResMed - Diamond in the rough
Fair Value:AU$4025.5% undervalued
1 followerusers have followed this narrative
0 commentsusers have commented on this narrative
0 likesusers have liked this narrative
Popular Narratives
OS


oscargarcia on NVIDIA ·
The company that went from selling GPUs to gamers to becoming the AI arms dealer of the 21st century.
Fair Value:US$28028.3% undervalued
227 followersusers have followed this narrative
9 commentsusers have commented on this narrative
15 likesusers have liked this narrative
CU

CubanEros on Microsoft ·
A wonderful business at reasonable price.
Fair Value:US$419.9110.7% overvalued
108 followersusers have followed this narrative
0 commentsusers have commented on this narrative
7 likesusers have liked this narrative
TR


tripledub on Alphabet ·
Warren Buffett Just Bet $10 Billion on Google. The Catch? You May Already Be Too Late.
Fair Value:US$23054.8% overvalued
121 followersusers have followed this narrative
1 commentusers have commented on this narrative
18 likesusers have liked this narrative
Trending Discussion
GR
greg_xasak on Fiserv ·
As someone who has dealt directly with them as a CTO for a credit union, I have 8 years of horror stories about doing business with them. If there was any other competitor than could deliver 80% of Fiserv services, there would be a mad rush to migrate to them. They should thank their lucky stars they are a near monopoly. this industry is so ripe for a well funded competitor. Their integration of technology is awful, their ability to fix their own implementation screwups is sadly tragic. Sometimes they just silently kill support tickets without resolution and you never find out until you do a follow up inquiry. Why, because sometimes no one you are dealing with knows how to fix it and knows no one to ask for help. They can not meet their own implementation deadlines and sometimes there is no one on a technical team dealing with you that has any banking or credit union experience. The is an industry insider phrase when you meet other Fiserv customers called being "Fiserved". It means telling others of your worst stories of dealing with them. Ask around, all CTO's have some doozies.
1
|0

