Advertisement
Should You Be Impressed By Dynemic Products' (NSE:DYNPRO) Returns on Capital?
If you're not sure where to start when looking for the next multi-bagger, there are a few key trends you should keep an eye out for. Firstly, we'll want to see a proven return on capital employed (ROCE) that is increasing, and secondly, an expanding base of capital employed. This shows us that it's a compounding machine, able to continually reinvest its earnings back into the business and generate higher returns. However, after briefly looking over the numbers, we don't think Dynemic Products (NSE:DYNPRO) has the makings of a multi-bagger going forward, but let's have a look at why that may be.
Return On Capital Employed (ROCE): What is it?
Just to clarify if you're unsure, ROCE is a metric for evaluating how much pre-tax income (in percentage terms) a company earns on the capital invested in its business. Analysts use this formula to calculate it for Dynemic Products:
Return on Capital Employed = Earnings Before Interest and Tax (EBIT) ÷ (Total Assets - Current Liabilities)
0.16 = ₹342m ÷ (₹2.5b - ₹367m) (Based on the trailing twelve months to June 2020).
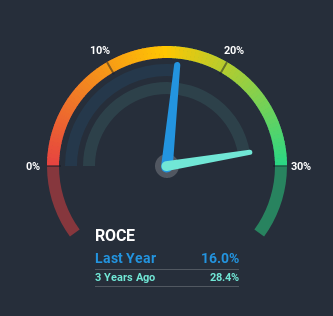
So, Dynemic Products has an ROCE of 16%. In absolute terms, that's a pretty normal return, and it's somewhat close to the Chemicals industry average of 13%.
See our latest analysis for Dynemic Products
While the past is not representative of the future, it can be helpful to know how a company has performed historically, which is why we have this chart above. If you're interested in investigating Dynemic Products' past further, check out this free graph of past earnings, revenue and cash flow.
What Does the ROCE Trend For Dynemic Products Tell Us?
In terms of Dynemic Products' historical ROCE movements, the trend isn't fantastic. Around five years ago the returns on capital were 22%, but since then they've fallen to 16%. However it looks like Dynemic Products might be reinvesting for long term growth because while capital employed has increased, the company's sales haven't changed much in the last 12 months. It's worth keeping an eye on the company's earnings from here on to see if these investments do end up contributing to the bottom line.
On a side note, Dynemic Products has done well to pay down its current liabilities to 15% of total assets. That could partly explain why the ROCE has dropped. Effectively this means their suppliers or short-term creditors are funding less of the business, which reduces some elements of risk. Since the business is basically funding more of its operations with it's own money, you could argue this has made the business less efficient at generating ROCE.The Bottom Line
Bringing it all together, while we're somewhat encouraged by Dynemic Products' reinvestment in its own business, we're aware that returns are shrinking. Yet to long term shareholders the stock has gifted them an incredible 132% return in the last three years, so the market appears to be rosy about its future. But if the trajectory of these underlying trends continue, we think the likelihood of it being a multi-bagger from here isn't high.
Dynemic Products does come with some risks though, we found 5 warning signs in our investment analysis, and 1 of those doesn't sit too well with us...
While Dynemic Products isn't earning the highest return, check out this free list of companies that are earning high returns on equity with solid balance sheets.
If you’re looking to trade Dynemic Products, open an account with the lowest-cost* platform trusted by professionals, Interactive Brokers. Their clients from over 200 countries and territories trade stocks, options, futures, forex, bonds and funds worldwide from a single integrated account. Promoted
New: Manage All Your Stock Portfolios in One Place
We've created the ultimate portfolio companion for stock investors, and it's free.
• Connect an unlimited number of Portfolios and see your total in one currency
• Be alerted to new Warning Signs or Risks via email or mobile
• Track the Fair Value of your stocks
This article by Simply Wall St is general in nature. It does not constitute a recommendation to buy or sell any stock, and does not take account of your objectives, or your financial situation. We aim to bring you long-term focused analysis driven by fundamental data. Note that our analysis may not factor in the latest price-sensitive company announcements or qualitative material. Simply Wall St has no position in any stocks mentioned.
*Interactive Brokers Rated Lowest Cost Broker by StockBrokers.com Annual Online Review 2020
Have feedback on this article? Concerned about the content? Get in touch with us directly. Alternatively, email editorial-team@simplywallst.com.
About NSEI:DYNPRO
Dynemic Products
Engages in the manufacture and sale of dyes and dye intermediates in India.
Flawless balance sheet and good value.
Market Insights


Advertisement
Weekly Picks
LO


Lou_Basenese on Giftify ·
Giftify ($GIFT): A Small-Cap Incentives Platform with More ScaleThan Its Valuation Suggests
Fair Value:US$2.565.7% undervalued
62 followersusers have followed this narrative
2 commentsusers have commented on this narrative
12 likesusers have liked this narrative
BE

benjamin_lvieq on PayPal Holdings ·
PayPal: PayPal Doesn't Need to Grow – It Needs to Stop Falling – A Mispriced Cash Machine With a Cannibal Buyback
Fair Value:US$6527.1% undervalued
17 followersusers have followed this narrative
0 commentsusers have commented on this narrative
5 likesusers have liked this narrative
JD

JD009 on Celsius Holdings ·
From $5M to $2B: Why the 2024 Crash Was the Best Buying Opportunity in Consumer Stocks
Fair Value:US$55.4345.6% undervalued
5 followersusers have followed this narrative
1 commentusers have commented on this narrative
6 likesusers have liked this narrative
WA

Wavefarer on Accenture ·
High-quality global services company facing an AI-driven valuation reset.
Fair Value:US$30155.3% undervalued
1 followerusers have followed this narrative
0 commentsusers have commented on this narrative
1 likeusers have liked this narrative
Recently Updated Narratives
TI

Tiguidou on NanoXplore ·
NanoXplore et le le Noir de Carbone
Fair Value:CA$14.5789.8% undervalued
1 followerusers have followed this narrative
0 commentsusers have commented on this narrative
0 likesusers have liked this narrative
RO


RockeTeller on Silver Mines ·
Australia’s Largest Undeveloped Silver Project Just Got a Low-Cost Makeover
Fair Value:AU$4.1996.8% undervalued
3 followersusers have followed this narrative
0 commentsusers have commented on this narrative
0 likesusers have liked this narrative
VA


Valtersa on Saudi National Bank ·
Projected Fair Value of Saudi National Bank Reaches 52
Fair Value:ر.س5228.2% undervalued
1 followerusers have followed this narrative
0 commentsusers have commented on this narrative
0 likesusers have liked this narrative
Popular Narratives
IN


Investingwilly on Mastercard ·
Mastercard: The Best Dividend Stock You're Ignoring
Fair Value:US$75028.3% undervalued
89 followersusers have followed this narrative
1 commentusers have commented on this narrative
9 likesusers have liked this narrative
BL


BlackGoat on Cerebras Systems ·
The Wafer Giant Threatening NVIDIA's GPU Hegemony
Fair Value:US$415.5451.0% undervalued
62 followersusers have followed this narrative
3 commentsusers have commented on this narrative
11 likesusers have liked this narrative
CE


Ceazar on Conexeu Sciences ·
This small biotech is developing technology that could potentially change how tissue is rebuilt
Fair Value:US$25.3462.5% undervalued
60 followersusers have followed this narrative
0 commentsusers have commented on this narrative
9 likesusers have liked this narrative
Trending Discussion

MA

Marek_Trnka on Space Exploration Technologies ·
I was right -15/7/2026 a return to the IPO price.
0
|0