
Advertisement
- United States
- /
- Professional Services
- /
- NasdaqGS:EXLS
Should We Worry About ExlService Holdings, Inc.'s (NASDAQ:EXLS) P/E Ratio?

Today, we'll introduce the concept of the P/E ratio for those who are learning about investing. To keep it practical, we'll show how ExlService Holdings, Inc.'s (NASDAQ:EXLS) P/E ratio could help you assess the value on offer. What is ExlService Holdings's P/E ratio? Well, based on the last twelve months it is 51.06. That corresponds to an earnings yield of approximately 2.0%.
See our latest analysis for ExlService Holdings
How Do I Calculate A Price To Earnings Ratio?
The formula for P/E is:
Price to Earnings Ratio = Share Price ÷ Earnings per Share (EPS)
Or for ExlService Holdings:
P/E of 51.06 = USD74.49 ÷ USD1.46 (Based on the trailing twelve months to September 2019.)
Is A High Price-to-Earnings Ratio Good?
A higher P/E ratio means that investors are paying a higher price for each USD1 of company earnings. That is not a good or a bad thing per se, but a high P/E does imply buyers are optimistic about the future.
Does ExlService Holdings Have A Relatively High Or Low P/E For Its Industry?
The P/E ratio essentially measures market expectations of a company. The image below shows that ExlService Holdings has a higher P/E than the average (32.0) P/E for companies in the it industry.
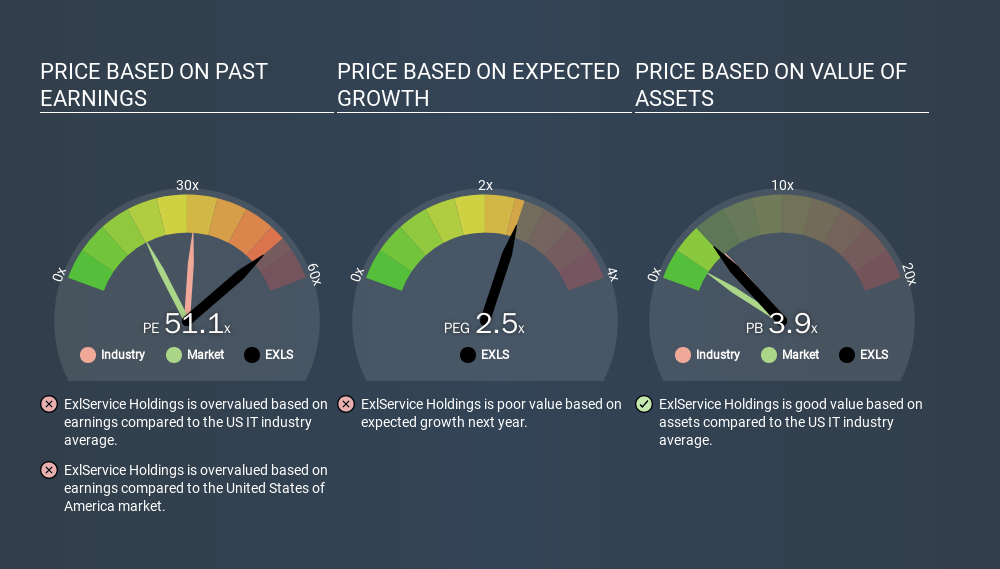
That means that the market expects ExlService Holdings will outperform other companies in its industry. Shareholders are clearly optimistic, but the future is always uncertain. So investors should always consider the P/E ratio alongside other factors, such as whether company directors have been buying shares.
How Growth Rates Impact P/E Ratios
If earnings fall then in the future the 'E' will be lower. That means even if the current P/E is low, it will increase over time if the share price stays flat. A higher P/E should indicate the stock is expensive relative to others -- and that may encourage shareholders to sell.
ExlService Holdings increased earnings per share by an impressive 15% over the last twelve months. And it has bolstered its earnings per share by 3.2% per year over the last five years. With that performance, you might expect an above average P/E ratio. But earnings per share are down 7.2% per year over the last three years.
A Limitation: P/E Ratios Ignore Debt and Cash In The Bank
The 'Price' in P/E reflects the market capitalization of the company. Thus, the metric does not reflect cash or debt held by the company. The exact same company would hypothetically deserve a higher P/E ratio if it had a strong balance sheet, than if it had a weak one with lots of debt, because a cashed up company can spend on growth.
Such spending might be good or bad, overall, but the key point here is that you need to look at debt to understand the P/E ratio in context.
ExlService Holdings's Balance Sheet
The extra options and safety that comes with ExlService Holdings's US$36m net cash position means that it deserves a higher P/E than it would if it had a lot of net debt.
The Verdict On ExlService Holdings's P/E Ratio
ExlService Holdings has a P/E of 51.1. That's higher than the average in its market, which is 18.4. With cash in the bank the company has plenty of growth options -- and it is already on the right track. Therefore it seems reasonable that the market would have relatively high expectations of the company
When the market is wrong about a stock, it gives savvy investors an opportunity. If the reality for a company is better than it expects, you can make money by buying and holding for the long term. So this free visual report on analyst forecasts could hold the key to an excellent investment decision.
Of course, you might find a fantastic investment by looking at a few good candidates. So take a peek at this free list of companies with modest (or no) debt, trading on a P/E below 20.
If you spot an error that warrants correction, please contact the editor at editorial-team@simplywallst.com. This article by Simply Wall St is general in nature. It does not constitute a recommendation to buy or sell any stock, and does not take account of your objectives, or your financial situation. Simply Wall St has no position in the stocks mentioned.
We aim to bring you long-term focused research analysis driven by fundamental data. Note that our analysis may not factor in the latest price-sensitive company announcements or qualitative material. Thank you for reading.
About NasdaqGS:EXLS
ExlService Holdings
Operates as a data analytics, and digital operations and solutions company in the United States and internationally.
Flawless balance sheet with solid track record.
Similar Companies
Market Insights

Advertisement
Community Narratives
Vita Life Sciences Set for a 12.72% Revenue Growth While Tackling Operational Challenges
Fair Value AU$2.42|12.0% undervalued
RO
Community Contributor
Vossloh rides a €500 billion wave to boost growth and earnings in the next decade
Fair Value €78.41|5.2% undervalued
CH
Community Contributor
Intuitive Surgical Will Transform Healthcare with 12% Revenue Growth
Fair Value US$325.55|57.3% overvalued
UN
Community Contributor