
Advertisement
- Australia
- /
- Metals and Mining
- /
- ASX:PRG
Should We Worry About CI Resources Limited's (ASX:CII) P/E Ratio?

This article is for investors who would like to improve their understanding of price to earnings ratios (P/E ratios). We'll look at CI Resources Limited's (ASX:CII) P/E ratio and reflect on what it tells us about the company's share price. Based on the last twelve months, CI Resources's P/E ratio is 15.46. That means that at current prices, buyers pay A$15.46 for every A$1 in trailing yearly profits.
See our latest analysis for CI Resources
How Do I Calculate A Price To Earnings Ratio?
The formula for price to earnings is:
Price to Earnings Ratio = Price per Share ÷ Earnings per Share (EPS)
Or for CI Resources:
P/E of 15.46 = A$1.16 ÷ A$0.08 (Based on the trailing twelve months to June 2019.)
Is A High Price-to-Earnings Ratio Good?
A higher P/E ratio means that buyers have to pay a higher price for each A$1 the company has earned over the last year. That isn't a good or a bad thing on its own, but a high P/E means that buyers have a higher opinion of the business's prospects, relative to stocks with a lower P/E.
How Does CI Resources's P/E Ratio Compare To Its Peers?
The P/E ratio indicates whether the market has higher or lower expectations of a company. The image below shows that CI Resources has a higher P/E than the average (12.2) P/E for companies in the metals and mining industry.
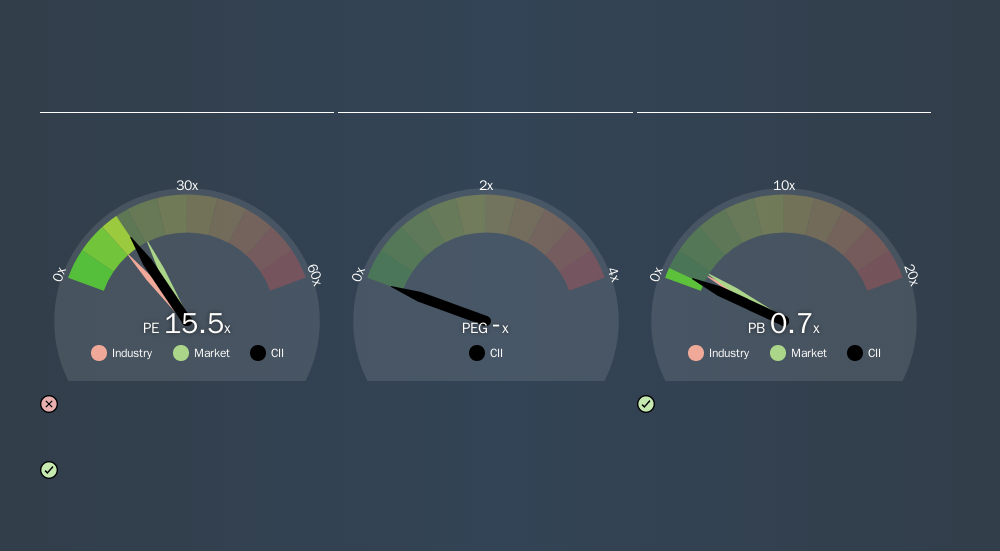
CI Resources's P/E tells us that market participants think the company will perform better than its industry peers, going forward.
How Growth Rates Impact P/E Ratios
If earnings fall then in the future the 'E' will be lower. That means even if the current P/E is low, it will increase over time if the share price stays flat. A higher P/E should indicate the stock is expensive relative to others -- and that may encourage shareholders to sell.
CI Resources shrunk earnings per share by 59% over the last year. And EPS is down 13% a year, over the last 5 years. This might lead to muted expectations. If the company can grow EPS strongly, the market may improve its opinion of it. I would further inform my view by checking insider buying and selling., among other things.
A Limitation: P/E Ratios Ignore Debt and Cash In The Bank
One drawback of using a P/E ratio is that it considers market capitalization, but not the balance sheet. So it won't reflect the advantage of cash, or disadvantage of debt. Theoretically, a business can improve its earnings (and produce a lower P/E in the future) by investing in growth. That means taking on debt (or spending its cash).
Such spending might be good or bad, overall, but the key point here is that you need to look at debt to understand the P/E ratio in context.
How Does CI Resources's Debt Impact Its P/E Ratio?
With net cash of AU$34m, CI Resources has a very strong balance sheet, which may be important for its business. Having said that, at 25% of its market capitalization the cash hoard would contribute towards a higher P/E ratio.
The Bottom Line On CI Resources's P/E Ratio
CI Resources trades on a P/E ratio of 15.5, which is below the AU market average of 18.7. Falling earnings per share are likely to be keeping potential buyers away, but the net cash position means the company has time to improve: if so, the low P/E could be an opportunity.
Investors should be looking to buy stocks that the market is wrong about. If the reality for a company is not as bad as the P/E ratio indicates, then the share price should increase as the market realizes this. Although we don't have analyst forecasts you could get a better understanding of its growth by checking out this more detailed historical graph of earnings, revenue and cash flow.
But note: CI Resources may not be the best stock to buy. So take a peek at this free list of interesting companies with strong recent earnings growth (and a P/E ratio below 20).
If you spot an error that warrants correction, please contact the editor at editorial-team@simplywallst.com. This article by Simply Wall St is general in nature. It does not constitute a recommendation to buy or sell any stock, and does not take account of your objectives, or your financial situation. Simply Wall St has no position in the stocks mentioned.
We aim to bring you long-term focused research analysis driven by fundamental data. Note that our analysis may not factor in the latest price-sensitive company announcements or qualitative material. Thank you for reading.
About ASX:PRG
PRL Global
Engages in the mining, processing, and sale of phosphate rock, phosphate dust, and chalk in Africa, Asia, Europe, Australia, North America, and Oceania.
Mediocre balance sheet with questionable track record.
Market Insights

Advertisement
Community Narratives
Vita Life Sciences Set for a 12.72% Revenue Growth While Tackling Operational Challenges
Fair Value AU$2.42|8.7% undervalued
RO
Community Contributor
Vossloh rides a €500 billion wave to boost growth and earnings in the next decade
Fair Value €78.41|6.3% undervalued
CH
Community Contributor
Intuitive Surgical Will Transform Healthcare with 12% Revenue Growth
Fair Value US$325.55|56.5% overvalued
UN
Community Contributor