Read This Before You Buy FBL Financial Group, Inc. (NYSE:FFG) Because Of Its P/E Ratio

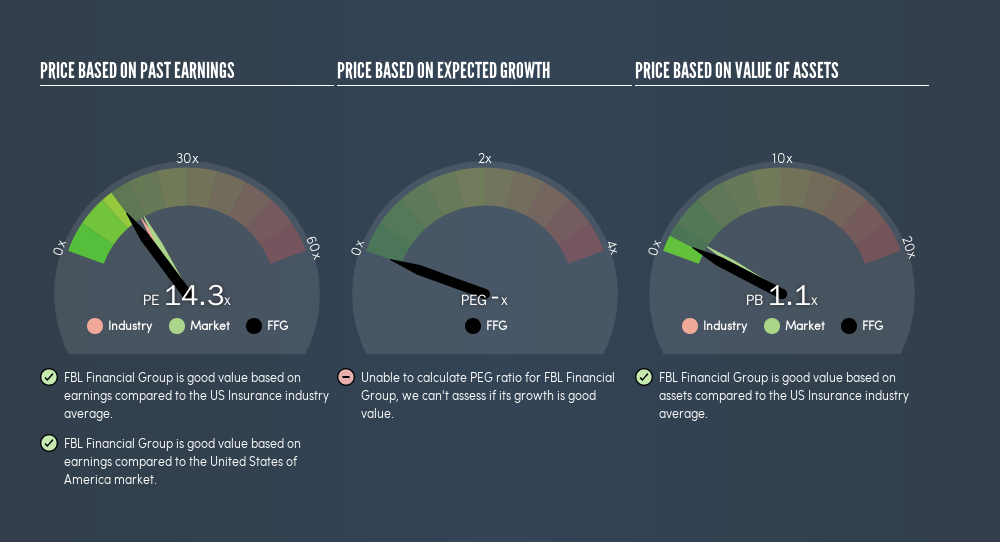
This article is written for those who want to get better at using price to earnings ratios (P/E ratios). To keep it practical, we'll show how FBL Financial Group, Inc.'s (NYSE:FFG) P/E ratio could help you assess the value on offer. What is FBL Financial Group's P/E ratio? Well, based on the last twelve months it is 14.27. That is equivalent to an earnings yield of about 7.0%.
See our latest analysis for FBL Financial Group
How Do You Calculate A P/E Ratio?
The formula for price to earnings is:
Price to Earnings Ratio = Price per Share ÷ Earnings per Share (EPS)
Or for FBL Financial Group:
P/E of 14.27 = $59.8 ÷ $4.19 (Based on the year to June 2019.)
Is A High P/E Ratio Good?
The higher the P/E ratio, the higher the price tag of a business, relative to its trailing earnings. That isn't necessarily good or bad, but a high P/E implies relatively high expectations of what a company can achieve in the future.
Does FBL Financial Group Have A Relatively High Or Low P/E For Its Industry?
The P/E ratio essentially measures market expectations of a company. If you look at the image below, you can see FBL Financial Group has a lower P/E than the average (16.7) in the insurance industry classification.
Its relatively low P/E ratio indicates that FBL Financial Group shareholders think it will struggle to do as well as other companies in its industry classification.
How Growth Rates Impact P/E Ratios
When earnings fall, the 'E' decreases, over time. Therefore, even if you pay a low multiple of earnings now, that multiple will become higher in the future. So while a stock may look cheap based on past earnings, it could be expensive based on future earnings.
FBL Financial Group shrunk earnings per share by 44% over the last year.
Don't Forget: The P/E Does Not Account For Debt or Bank Deposits
The 'Price' in P/E reflects the market capitalization of the company. In other words, it does not consider any debt or cash that the company may have on the balance sheet. In theory, a company can lower its future P/E ratio by using cash or debt to invest in growth.
Spending on growth might be good or bad a few years later, but the point is that the P/E ratio does not account for the option (or lack thereof).
So What Does FBL Financial Group's Balance Sheet Tell Us?
FBL Financial Group has net debt worth just 4.5% of its market capitalization. It would probably trade on a higher P/E ratio if it had a lot of cash, but I doubt it is having a big impact.
The Bottom Line On FBL Financial Group's P/E Ratio
FBL Financial Group trades on a P/E ratio of 14.3, which is below the US market average of 17.5. Since it only carries a modest debt load, it's likely the low expectations implied by the P/E ratio arise from the lack of recent earnings growth.
When the market is wrong about a stock, it gives savvy investors an opportunity. As value investor Benjamin Graham famously said, 'In the short run, the market is a voting machine but in the long run, it is a weighing machine.' So this free visualization of the analyst consensus on future earnings could help you make the right decision about whether to buy, sell, or hold.
But note: FBL Financial Group may not be the best stock to buy. So take a peek at this free list of interesting companies with strong recent earnings growth (and a P/E ratio below 20).
We aim to bring you long-term focused research analysis driven by fundamental data. Note that our analysis may not factor in the latest price-sensitive company announcements or qualitative material.
If you spot an error that warrants correction, please contact the editor at editorial-team@simplywallst.com. This article by Simply Wall St is general in nature. It does not constitute a recommendation to buy or sell any stock, and does not take account of your objectives, or your financial situation. Simply Wall St has no position in the stocks mentioned. Thank you for reading.
Market Insights

Weekly Picks

Early mover in a fast growing industry. Likely to experience share price volatility as they scale


A case for CA$31.80 (undiluted), aka 8,616% upside from CA$0.37 (an 86 bagger!).


Moderation and Stabilisation: HOLD: Fair Price based on a 4-year Cycle is $12.08
Recently Updated Narratives

Airbnb Stock: Platform Growth in a World of Saturation and Scrutiny

Adobe Stock: AI-Fueled ARR Growth Pushes Guidance Higher, But Cost Pressures Loom

Thomson Reuters Stock: When Legal Intelligence Becomes Mission-Critical Infrastructure
Popular Narratives


Crazy Undervalued 42 Baggers Silver Play (Active & Running Mine)


NVDA: Expanding AI Demand Will Drive Major Data Center Investments Through 2026

The AI Infrastructure Giant Grows Into Its Valuation
Trending Discussion


