Stock Analysis
- India
- /
- Hospitality
- /
- NSEI:ROHLTD
Read This Before Buying Royal Orchid Hotels Limited (NSE:ROHLTD) For Its Dividend


Could Royal Orchid Hotels Limited (NSE:ROHLTD) be an attractive dividend share to own for the long haul? Investors are often drawn to strong companies with the idea of reinvesting the dividends. Yet sometimes, investors buy a popular dividend stock because of its yield, and then lose money if the company's dividend doesn't live up to expectations.
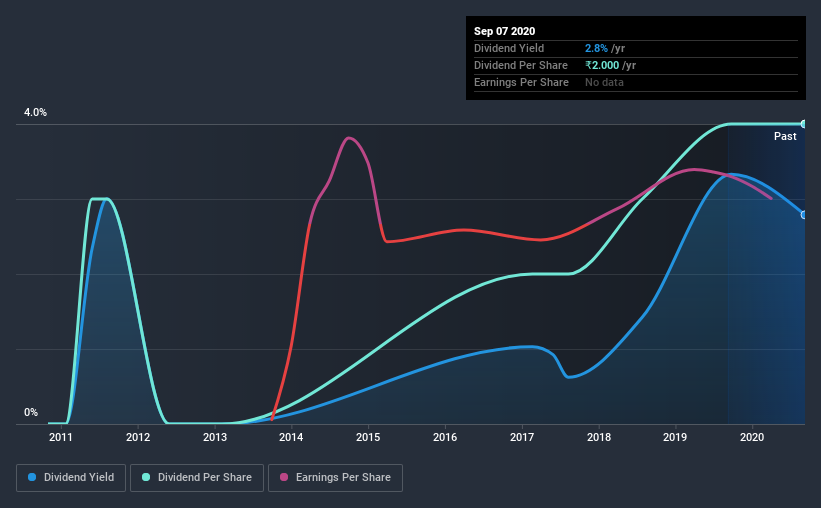
With a 2.8% yield and a nine-year payment history, investors probably think Royal Orchid Hotels looks like a reliable dividend stock. A 2.8% yield is not inspiring, but the longer payment history has some appeal. Some simple analysis can offer a lot of insights when buying a company for its dividend, and we'll go through this below.
Click the interactive chart for our full dividend analysis
Payout ratios
Dividends are usually paid out of company earnings. If a company is paying more than it earns, then the dividend might become unsustainable - hardly an ideal situation. As a result, we should always investigate whether a company can afford its dividend, measured as a percentage of a company's net income after tax. Royal Orchid Hotels paid out 98% of its profit as dividends, over the trailing twelve month period. Its payout ratio is quite high, and the dividend is not well covered by earnings. If earnings are growing or the company has a large cash balance, this might be sustainable - still, we think it is a concern.
Is Royal Orchid Hotels' Balance Sheet Risky?
As Royal Orchid Hotels' dividend was not well covered by earnings, we need to check its balance sheet for signs of financial distress. A rough way to check this is with these two simple ratios: a) net debt divided by EBITDA (earnings before interest, tax, depreciation and amortisation), and b) net interest cover. Net debt to EBITDA measures total debt load relative to company earnings (lower = less debt), while net interest cover measures the ability to pay interest on the debt (higher = greater ability to pay interest costs). Royal Orchid Hotels has net debt of 1.46 times its EBITDA, which is generally an okay level of debt for most companies.
Net interest cover can be calculated by dividing earnings before interest and tax (EBIT) by the company's net interest expense. With EBIT of less than 1 times its interest expense, Royal Orchid Hotels' financial situation is potentially quite concerning. Readers should investigate whether it might be at risk of breaching the minimum requirements on its loans.
Consider getting our latest analysis on Royal Orchid Hotels' financial position here.
Dividend Volatility
One of the major risks of relying on dividend income, is the potential for a company to struggle financially and cut its dividend. Not only is your income cut, but the value of your investment declines as well - nasty. The first recorded dividend for Royal Orchid Hotels, in the last decade, was nine years ago. It's good to see that Royal Orchid Hotels has been paying a dividend for a number of years. However, the dividend has been cut at least once in the past, and we're concerned that what has been cut once, could be cut again. During the past nine-year period, the first annual payment was ₹1.5 in 2011, compared to ₹2.0 last year. This works out to be a compound annual growth rate (CAGR) of approximately 3.2% a year over that time. The growth in dividends has not been linear, but the CAGR is a decent approximation of the rate of change over this time frame.
It's good to see some dividend growth, but the dividend has been cut at least once, and the size of the cut would eliminate most of the growth, anyway. We're not that enthused by this.
Dividend Growth Potential
With a relatively unstable dividend, it's even more important to evaluate if earnings per share (EPS) are growing - it's not worth taking the risk on a dividend getting cut, unless you might be rewarded with larger dividends in future. It's good to see Royal Orchid Hotels has been growing its earnings per share at 46% a year over the past five years. Earnings per share have been growing very rapidly, although the company is also paying out virtually all of its profit in dividends. While EPS could grow fast enough to make the dividend sustainable, in this type of situation, we'd want to pay extra attention to any fragilities in the company's balance sheet.
Conclusion
Dividend investors should always want to know if a) a company's dividends are affordable, b) if there is a track record of consistent payments, and c) if the dividend is capable of growing. Royal Orchid Hotels is paying out a larger percentage of its profit than we're comfortable with. We were also glad to see it growing earnings, but it was concerning to see the dividend has been cut at least once in the past. While we're not hugely bearish on it, overall we think there are potentially better dividend stocks than Royal Orchid Hotels out there.
Market movements attest to how highly valued a consistent dividend policy is compared to one which is more unpredictable. At the same time, there are other factors our readers should be conscious of before pouring capital into a stock. To that end, Royal Orchid Hotels has 5 warning signs (and 1 which makes us a bit uncomfortable) we think you should know about.
We have also put together a list of global stocks with a market capitalisation above $1bn and yielding more 3%.
If you decide to trade Royal Orchid Hotels, use the lowest-cost* platform that is rated #1 Overall by Barron’s, Interactive Brokers. Trade stocks, options, futures, forex, bonds and funds on 135 markets, all from a single integrated account. Promoted
Valuation is complex, but we're helping make it simple.
Find out whether Royal Orchid Hotels is potentially over or undervalued by checking out our comprehensive analysis, which includes fair value estimates, risks and warnings, dividends, insider transactions and financial health.
View the Free AnalysisThis article by Simply Wall St is general in nature. It does not constitute a recommendation to buy or sell any stock, and does not take account of your objectives, or your financial situation. We aim to bring you long-term focused analysis driven by fundamental data. Note that our analysis may not factor in the latest price-sensitive company announcements or qualitative material. Simply Wall St has no position in any stocks mentioned.
*Interactive Brokers Rated Lowest Cost Broker by StockBrokers.com Annual Online Review 2020
Have feedback on this article? Concerned about the content? Get in touch with us directly. Alternatively, email editorial-team@simplywallst.com.
About NSEI:ROHLTD
Excellent balance sheet with acceptable track record.
