Advertisement
- India
- /
- Electric Utilities
- /
- NSEI:ENERGYDEV
Read This Before Buying Energy Development Company Limited (NSE:ENERGYDEV) For Its Dividend
Dividend paying stocks like Energy Development Company Limited (NSE:ENERGYDEV) tend to be popular with investors, and for good reason - some research suggests a significant amount of all stock market returns come from reinvested dividends. If you are hoping to live on the income from dividends, it's important to be a lot more stringent with your investments than the average punter.
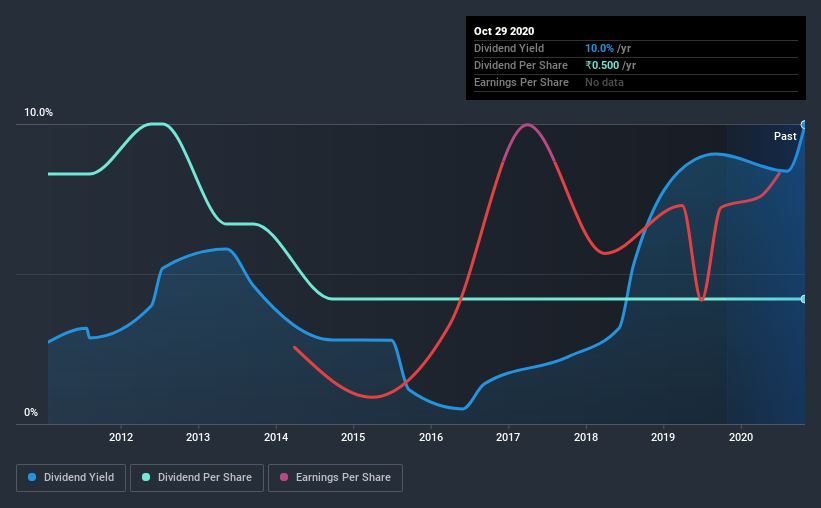
In this case, Energy Development likely looks attractive to investors, given its 10.0% dividend yield and a payment history of over ten years. It would not be a surprise to discover that many investors buy it for the dividends. Before you buy any stock for its dividend however, you should always remember Warren Buffett's two rules: 1) Don't lose money, and 2) Remember rule #1. We'll run through some checks below to help with this.
Explore this interactive chart for our latest analysis on Energy Development!
Payout ratios
Dividends are typically paid from company earnings. If a company pays more in dividends than it earned, then the dividend might become unsustainable - hardly an ideal situation. As a result, we should always investigate whether a company can afford its dividend, measured as a percentage of a company's net income after tax. While Energy Development pays a dividend, it reported a loss over the last year. When a company recently reported a loss, we should investigate if its cash flows covered the dividend.
Energy Development paid out 13% of its free cash flow as dividends last year, which is conservative and suggests the dividend is sustainable.
Remember, you can always get a snapshot of Energy Development's latest financial position, by checking our visualisation of its financial health.
Dividend Volatility
Before buying a stock for its income, we want to see if the dividends have been stable in the past, and if the company has a track record of maintaining its dividend. For the purpose of this article, we only scrutinise the last decade of Energy Development's dividend payments. The dividend has been cut on at least one occasion historically. During the past 10-year period, the first annual payment was ₹1.0 in 2010, compared to ₹0.5 last year. The dividend has shrunk at around 6.7% a year during that period. Energy Development's dividend hasn't shrunk linearly at 6.7% per annum, but the CAGR is a useful estimate of the historical rate of change.
A shrinking dividend over a 10-year period is not ideal, and we'd be concerned about investing in a dividend stock that lacks a solid record of growing dividends per share.
Dividend Growth Potential
With a relatively unstable dividend, and a poor history of shrinking dividends, it's even more important to see if EPS are growing. Strong earnings per share (EPS) growth might encourage our interest in the company despite fluctuating dividends, which is why it's great to see Energy Development has grown its earnings per share at 19% per annum over the past five years. Earnings per share have been growing at a good rate, and the company is paying less than half its earnings as dividends. We generally think this is an attractive combination, as it permits further reinvestment in the business.
Conclusion
To summarise, shareholders should always check that Energy Development's dividends are affordable, that its dividend payments are relatively stable, and that it has decent prospects for growing its earnings and dividend. We're not keen on the fact that Energy Development paid dividends despite reporting a loss over the past year, although fortunately its dividend was covered by cash flow. We were also glad to see it growing earnings, but it was concerning to see the dividend has been cut at least once in the past. Ultimately, Energy Development comes up short on our dividend analysis. It's not that we think it is a bad company - just that there are likely more appealing dividend prospects out there on this analysis.
Investors generally tend to favour companies with a consistent, stable dividend policy as opposed to those operating an irregular one. At the same time, there are other factors our readers should be conscious of before pouring capital into a stock. Just as an example, we've come accross 4 warning signs for Energy Development you should be aware of, and 1 of them is significant.
Looking for more high-yielding dividend ideas? Try our curated list of dividend stocks with a yield above 3%.
If you decide to trade Energy Development, use the lowest-cost* platform that is rated #1 Overall by Barron’s, Interactive Brokers. Trade stocks, options, futures, forex, bonds and funds on 135 markets, all from a single integrated account. Promoted
Valuation is complex, but we're here to simplify it.
Discover if Energy Development might be undervalued or overvalued with our detailed analysis, featuring fair value estimates, potential risks, dividends, insider trades, and its financial condition.
Access Free AnalysisThis article by Simply Wall St is general in nature. It does not constitute a recommendation to buy or sell any stock, and does not take account of your objectives, or your financial situation. We aim to bring you long-term focused analysis driven by fundamental data. Note that our analysis may not factor in the latest price-sensitive company announcements or qualitative material. Simply Wall St has no position in any stocks mentioned.
*Interactive Brokers Rated Lowest Cost Broker by StockBrokers.com Annual Online Review 2020
Have feedback on this article? Concerned about the content? Get in touch with us directly. Alternatively, email editorial-team@simplywallst.com.
About NSEI:ENERGYDEV
Energy Development
Generates and sells electricity from water and wind to various electricity boards in India.
Slight risk and slightly overvalued.
Market Insights

Advertisement
Weekly Picks
LO


Lou_Basenese on Cue Biopharma ·
Cue Biopharma (NASDAQ: CUE): The Scientist Behind Xolair Just Gave Cue a Next-Generation Shot at the Same Multi-Billion-Dollar Market
Fair Value:US$7057.7% undervalued
9 followersusers have followed this narrative
0 commentsusers have commented on this narrative
4 likesusers have liked this narrative
HE


HedgeY on AST SpaceMobile ·
AST SpaceMobile: The Boldest Direct-to-Cell Bet in Public Markets
Fair Value:US$17036.9% undervalued
33 followersusers have followed this narrative
0 commentsusers have commented on this narrative
10 likesusers have liked this narrative
FU

FundamentalFlow on Onto Innovation ·
Onto Innovation: The Advanced Packaging Chokepoint 51.3% undervalued intrinsic discount
Fair Value:US$38027.7% undervalued
23 followersusers have followed this narrative
0 commentsusers have commented on this narrative
6 likesusers have liked this narrative
MA


martinarauz on Nu Holdings ·
Investment Analysis (May 2026)
Fair Value:US$22.7446.7% undervalued
55 followersusers have followed this narrative
0 commentsusers have commented on this narrative
14 likesusers have liked this narrative
Recently Updated Narratives
IM


Imthetxarbi on Sylvania Platinum ·
A Debt-Free PGM Producer Trading at 2x EBITDA With a 10% Dividend Yield Nobody Is Talking About
Fair Value:UK£2.0855.3% undervalued
1 followerusers have followed this narrative
0 commentsusers have commented on this narrative
0 likesusers have liked this narrative
IM

Imthetxarbi on Watches of Switzerland Group ·
A Compelling Compounder at a Retailer's Multiple
Fair Value:UK£1134.8% undervalued
1 followerusers have followed this narrative
0 commentsusers have commented on this narrative
0 likesusers have liked this narrative
KA


kapirey on Zijin Mining Group ·
Zijin Mining is a scaled, globally diversified mining platform
Fair Value:HK$60.1444.6% undervalued
2 followersusers have followed this narrative
0 commentsusers have commented on this narrative
0 likesusers have liked this narrative
Popular Narratives
CL


Clive_Thompson on Take-Two Interactive Software ·
Take-Two Interactive: The Calm Before the Storm NASDAQ: TTWO Last Price: $242.41 Date: May 15, 2026
Fair Value:US$276.9721.8% undervalued
56 followersusers have followed this narrative
0 commentsusers have commented on this narrative
14 likesusers have liked this narrative
MA
martinarauz on Nu Holdings ·
Investment Analysis (May 2026)
Fair Value:US$22.7446.7% undervalued
55 followersusers have followed this narrative
0 commentsusers have commented on this narrative
14 likesusers have liked this narrative
NI


niteco on Honeywell International ·
Honeywell - The Demand-Side of the AI Infrastructure
Fair Value:US$320.1932.0% undervalued
46 followersusers have followed this narrative
0 commentsusers have commented on this narrative
19 likesusers have liked this narrative
Trending Discussion

FR

FrontierTom on United States Antimony ·
Great Long term play that needs great tolerance for price swings along the way.
0
|0
