
Advertisement
Nilkamal Limited (NSE:NILKAMAL) Is Up But Financials Look Inconsistent: Which Way Is The Stock Headed?
Nilkamal's (NSE:NILKAMAL) stock is up by 6.7% over the past three months. Given that the stock prices usually follow long-term business performance, we wonder if the company's mixed financials could have any adverse effect on its current price price movement Specifically, we decided to study Nilkamal's ROE in this article.
Return on Equity or ROE is a test of how effectively a company is growing its value and managing investors’ money. In short, ROE shows the profit each dollar generates with respect to its shareholder investments.
View our latest analysis for Nilkamal
How Is ROE Calculated?
The formula for return on equity is:
Return on Equity = Net Profit (from continuing operations) ÷ Shareholders' Equity
So, based on the above formula, the ROE for Nilkamal is:
8.0% = ₹824m ÷ ₹10b (Based on the trailing twelve months to June 2020).
The 'return' refers to a company's earnings over the last year. That means that for every ₹1 worth of shareholders' equity, the company generated ₹0.08 in profit.
What Has ROE Got To Do With Earnings Growth?
Thus far, we have learned that ROE measures how efficiently a company is generating its profits. Based on how much of its profits the company chooses to reinvest or "retain", we are then able to evaluate a company's future ability to generate profits. Assuming all else is equal, companies that have both a higher return on equity and higher profit retention are usually the ones that have a higher growth rate when compared to companies that don't have the same features.
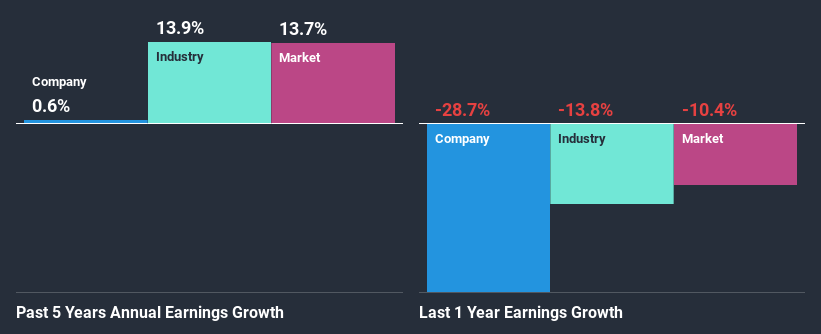
A Side By Side comparison of Nilkamal's Earnings Growth And 8.0% ROE
It is quite clear that Nilkamal's ROE is rather low. An industry comparison shows that the company's ROE is not much different from the industry average of 8.8% either. Thus, the low ROE provides some context to Nilkamal's flat net income growth over the past five years.
Next, on comparing with the industry net income growth, we found that Nilkamal's reported growth was lower than the industry growth of 14% in the same period, which is not something we like to see.
The basis for attaching value to a company is, to a great extent, tied to its earnings growth. It’s important for an investor to know whether the market has priced in the company's expected earnings growth (or decline). Doing so will help them establish if the stock's future looks promising or ominous. One good indicator of expected earnings growth is the P/E ratio which determines the price the market is willing to pay for a stock based on its earnings prospects. So, you may want to check if Nilkamal is trading on a high P/E or a low P/E, relative to its industry.
Is Nilkamal Efficiently Re-investing Its Profits?
Nilkamal has a low three-year median payout ratio of 16% (or a retention ratio of 84%) but the negligible earnings growth number doesn't reflect this as high growth usually follows high profit retention.
Additionally, Nilkamal has paid dividends over a period of at least ten years, which means that the company's management is determined to pay dividends even if it means little to no earnings growth.
Summary
In total, we're a bit ambivalent about Nilkamal's performance. While the company does have a high rate of profit retention, its low rate of return is probably hampering its earnings growth. That being so, the latest analyst forecasts show that the company will continue to see an expansion in its earnings. To know more about the latest analysts predictions for the company, check out this visualization of analyst forecasts for the company.
When trading Nilkamal or any other investment, use the platform considered by many to be the Professional's Gateway to the Worlds Market, Interactive Brokers. You get the lowest-cost* trading on stocks, options, futures, forex, bonds and funds worldwide from a single integrated account. Promoted
Valuation is complex, but we're here to simplify it.
Discover if Nilkamal might be undervalued or overvalued with our detailed analysis, featuring fair value estimates, potential risks, dividends, insider trades, and its financial condition.
Access Free AnalysisThis article by Simply Wall St is general in nature. It does not constitute a recommendation to buy or sell any stock, and does not take account of your objectives, or your financial situation. We aim to bring you long-term focused analysis driven by fundamental data. Note that our analysis may not factor in the latest price-sensitive company announcements or qualitative material. Simply Wall St has no position in any stocks mentioned.
*Interactive Brokers Rated Lowest Cost Broker by StockBrokers.com Annual Online Review 2020
Have feedback on this article? Concerned about the content? Get in touch with us directly. Alternatively, email editorial-team@simplywallst.com.
About NSEI:NILKAMAL
Nilkamal
Manufactures and sells plastic products in India and internationally.
Excellent balance sheet with reasonable growth potential and pays a dividend.
Similar Companies
Market Insights

Advertisement
Community Narratives
The company that turned a verb into a global necessity and basically runs the modern internet, digital ads, smartphones, maps, and AI.
Fair Value US$300.00|10.2% undervalued
OS
Community Contributor
Flowers Foods Pays A Fair Price For Health
Fair Value US$16.12|20.3% undervalued
NV
Community Contributor
TMX Group will thrive with 33.3% profit margin and enduring market moat
Fair Value CA$49.90|0.1% undervalued
LI
Community Contributor