Advertisement
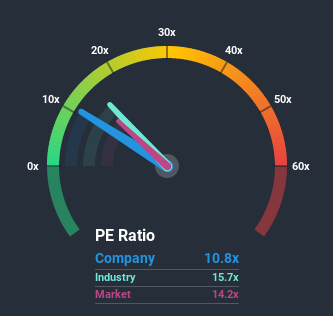
With a price-to-earnings (or "P/E") ratio of 10.8x Jensen-Group NV (EBR:JEN) may be sending bullish signals at the moment, given that almost half of all companies in Belgium have P/E ratios greater than 15x and even P/E's higher than 25x are not unusual. Although, it's not wise to just take the P/E at face value as there may be an explanation why it's limited.
Jensen-Group could be doing better as its earnings have been going backwards lately while most other companies have been seeing positive earnings growth. It seems that many are expecting the dour earnings performance to persist, which has repressed the P/E. If this is the case, then existing shareholders will probably struggle to get excited about the future direction of the share price.
See our latest analysis for Jensen-Group
How Is Jensen-Group's Growth Trending?
In order to justify its P/E ratio, Jensen-Group would need to produce sluggish growth that's trailing the market.
Taking a look back first, the company's earnings per share growth last year wasn't something to get excited about as it posted a disappointing decline of 18%. As a result, earnings from three years ago have also fallen 8.9% overall. Therefore, it's fair to say the earnings growth recently has been undesirable for the company.
Turning to the outlook, the next three years should bring diminished returns, with earnings decreasing 0.4% per year as estimated by the lone analyst watching the company. That's not great when the rest of the market is expected to grow by 8.2% per year.
In light of this, it's understandable that Jensen-Group's P/E would sit below the majority of other companies. However, shrinking earnings are unlikely to lead to a stable P/E over the longer term. There's potential for the P/E to fall to even lower levels if the company doesn't improve its profitability.
What We Can Learn From Jensen-Group's P/E?
It's argued the price-to-earnings ratio is an inferior measure of value within certain industries, but it can be a powerful business sentiment indicator.
We've established that Jensen-Group maintains its low P/E on the weakness of its forecast for sliding earnings, as expected. At this stage investors feel the potential for an improvement in earnings isn't great enough to justify a higher P/E ratio. Unless these conditions improve, they will continue to form a barrier for the share price around these levels.
The company's balance sheet is another key area for risk analysis. You can assess many of the main risks through our free balance sheet analysis for Jensen-Group with six simple checks.
You might be able to find a better investment than Jensen-Group. If you want a selection of possible candidates, check out this free list of interesting companies that trade on a P/E below 20x (but have proven they can grow earnings).
If you’re looking to trade Jensen-Group, open an account with the lowest-cost* platform trusted by professionals, Interactive Brokers. Their clients from over 200 countries and territories trade stocks, options, futures, forex, bonds and funds worldwide from a single integrated account.Promoted
New: Manage All Your Stock Portfolios in One Place
We've created the ultimate portfolio companion for stock investors, and it's free.
• Connect an unlimited number of Portfolios and see your total in one currency
• Be alerted to new Warning Signs or Risks via email or mobile
• Track the Fair Value of your stocks
This article by Simply Wall St is general in nature. It does not constitute a recommendation to buy or sell any stock, and does not take account of your objectives, or your financial situation. We aim to bring you long-term focused analysis driven by fundamental data. Note that our analysis may not factor in the latest price-sensitive company announcements or qualitative material. Simply Wall St has no position in any stocks mentioned.
*Interactive Brokers Rated Lowest Cost Broker by StockBrokers.com Annual Online Review 2020
Have feedback on this article? Concerned about the content? Get in touch with us directly. Alternatively, email editorial-team@simplywallst.com.
About ENXTBR:JEN
Jensen-Group
Designs, produces, and supplies single machines, systems, turnkey solutions, and laundry process automation for the heavy-duty laundry industry.
Flawless balance sheet and undervalued.
Market Insights


Advertisement
Weekly Picks
LO


Lou_Basenese on Optimi Health ·
The Only Psychedelic Company Already Selling MDMA and Psilocybin to Real Patients, Yet Priced Like It Doesn’t Exist
Fair Value:US$1155.3% undervalued
50 followersusers have followed this narrative
2 commentsusers have commented on this narrative
9 likesusers have liked this narrative
WE


WealthAP on Novo Nordisk ·
Novo Nordisk (NVO): Is the "Easy Growth" Story Over?
Fair Value:DKK 407.7719.9% undervalued
69 followersusers have followed this narrative
0 commentsusers have commented on this narrative
8 likesusers have liked this narrative
VA


ValueInvestingSubstack on Zoetis ·
Zoetis down -50% over the past year
Fair Value:US$92.9217.2% undervalued
23 followersusers have followed this narrative
0 commentsusers have commented on this narrative
9 likesusers have liked this narrative
CE


CentryResearch on Centrus Energy ·
Centrus Energy: The Next Nuclear Bottleneck Isn't Reactors. It's Fuel.
Fair Value:US$1907.4% undervalued
24 followersusers have followed this narrative
0 commentsusers have commented on this narrative
11 likesusers have liked this narrative
Recently Updated Narratives
BR


Brunhilde_Wagner on Copart ·
Compounder to Cash Generator in Real Time
Fair Value:US$2710.3% overvalued
1 followerusers have followed this narrative
0 commentsusers have commented on this narrative
0 likesusers have liked this narrative
WI

WisetoWealth on PayPal Holdings ·
The Underrated Transformation of a Digital Payments Giant
Fair Value:US$90.3137.9% undervalued
6 followersusers have followed this narrative
0 commentsusers have commented on this narrative
0 likesusers have liked this narrative
BL


Blagget on Terra Balcanica Resources ·
The C$4M Explorer Positioned to Become Europe's First Antimony Mine
Fair Value:CA$0.487.5% undervalued
3 followersusers have followed this narrative
0 commentsusers have commented on this narrative
0 likesusers have liked this narrative
Popular Narratives
CU

CubanEros on Microsoft ·
A wonderful business at reasonable price.
Fair Value:US$419.917.3% undervalued
85 followersusers have followed this narrative
0 commentsusers have commented on this narrative
6 likesusers have liked this narrative
OS


oscargarcia on NVIDIA ·
The company that went from selling GPUs to gamers to becoming the AI arms dealer of the 21st century.
Fair Value:US$28029.8% undervalued
193 followersusers have followed this narrative
9 commentsusers have commented on this narrative
15 likesusers have liked this narrative
BE
benjamin_lvieq on PayPal Holdings ·
PayPal: PayPal Doesn't Need to Grow – It Needs to Stop Falling – A Mispriced Cash Machine With a Cannibal Buyback
Fair Value:US$6513.7% undervalued
72 followersusers have followed this narrative
2 commentsusers have commented on this narrative
11 likesusers have liked this narrative
Trending Discussion
DE

derek_3wsdg on Teladoc Health ·
You’ve overlooked the activist investor factor. Travis Cocke’s Voss has announced 5% ownership through a 13G filing. They’ve added to that 5% since, and in doing so, have created a structural trap door for 27.42 Million Shares actively sold short. Chuck will announce lots of positives on July 29 but it’s what Voss announces shortly after that will rock the overextended Teledoc shorts. The Walmart partnership is the tip of the iceberg. The market is missing the sheer regulatory and enterprise friction of modern corporate healthcare. Teladoc isn't a "consumer app"; it is the primary digital infrastructure integrated directly into the legacy backends of Tier-1 insurance companies and fortune 500 employers, covering 105 million+ lives. Teladoc is acting as the digital top-of-funnel engine for the world's largest retailer. If Voss pushes the narrative that Teladoc is effectively the outsourced digital brain of Walmart's entire healthcare footprint, the fair value shifts from a basic health multiple to an enterprise distribution premium. Additionally , we are in a structural gold rush for high-quality, legally compliant, longitudinal medical data to train vertical healthcare AI models. Large technology hyperscalers and pharmaceutical giants cannot simply scrape the internet for this; they need structured clinical inputs. Teladoc sits on one of the largest de-identified virtual medical datasets on earth. From the activist playbook , we’ll see Voss demand the immediate creation of a Data & Diagnostics Licensing Division, transforming a legacy liability into an incredibly high-margin, pure-software data asset that requires zero human clinician hours to scale. Chuck is doing great work and deserves credi5 for the Teledoc turnaround but it will be Travis Cocke who will be responsible for a share price way beyond your $15 valuation.
1
|0

