Advertisement
- United States
- /
- Luxury
- /
- NYSE:UAA
Is Under Armour (NYSE:UAA) Using Too Much Debt?
Warren Buffett famously said, 'Volatility is far from synonymous with risk.' When we think about how risky a company is, we always like to look at its use of debt, since debt overload can lead to ruin. Importantly, Under Armour, Inc. (NYSE:UAA) does carry debt. But is this debt a concern to shareholders?
Why Does Debt Bring Risk?
Debt is a tool to help businesses grow, but if a business is incapable of paying off its lenders, then it exists at their mercy. If things get really bad, the lenders can take control of the business. However, a more usual (but still expensive) situation is where a company must dilute shareholders at a cheap share price simply to get debt under control. Of course, plenty of companies use debt to fund growth, without any negative consequences. When we examine debt levels, we first consider both cash and debt levels, together.
See our latest analysis for Under Armour
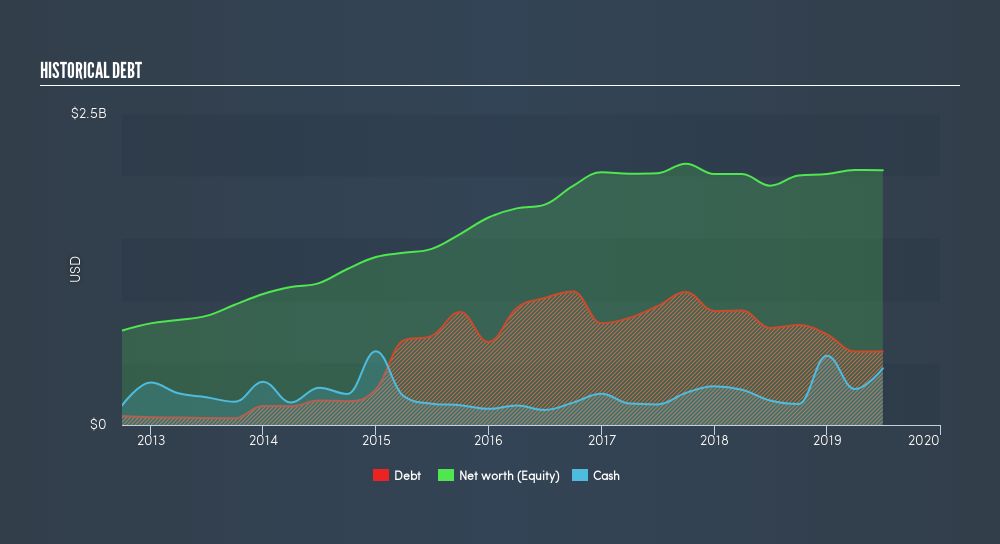
What Is Under Armour's Net Debt?
As you can see below, Under Armour had US$591.4m of debt at June 2019, down from US$779.4m a year prior. However, it also had US$455.7m in cash, and so its net debt is US$135.7m.
How Healthy Is Under Armour's Balance Sheet?
We can see from the most recent balance sheet that Under Armour had liabilities of US$1.33b falling due within a year, and liabilities of US$1.30b due beyond that. Offsetting these obligations, it had cash of US$455.7m as well as receivables valued at US$740.4m due within 12 months. So its liabilities outweigh the sum of its cash and (near-term) receivables by US$1.44b.
Of course, Under Armour has a market capitalization of US$8.11b, so these liabilities are probably manageable. But there are sufficient liabilities that we would certainly recommend shareholders continue to monitor the balance sheet, going forward.
We measure a company's debt load relative to its earnings power by looking at its net debt divided by its earnings before interest, tax, depreciation, and amortization (EBITDA) and by calculating how easily its earnings before interest and tax (EBIT) cover its interest expense (interest cover). The advantage of this approach is that we take into account both the absolute quantum of debt (with net debt to EBITDA) and the actual interest expenses associated with that debt (with its interest cover ratio).
With net debt sitting at just 0.34 times EBITDA, Under Armour is arguably pretty conservatively geared. And this view is supported by the solid interest coverage, with EBIT coming in at 7.9 times the interest expense over the last year. In addition to that, we're happy to report that Under Armour has boosted its EBIT by 44%, thus reducing the spectre of future debt repayments. The balance sheet is clearly the area to focus on when you are analysing debt. But it is future earnings, more than anything, that will determine Under Armour's ability to maintain a healthy balance sheet going forward. So if you want to see what the professionals think, you might find this free report on analyst profit forecasts to be interesting.
Finally, a company can only pay off debt with cold hard cash, not accounting profits. So we always check how much of that EBIT is translated into free cash flow. Over the last three years, Under Armour actually produced more free cash flow than EBIT. That sort of strong cash conversion gets us as excited as the crowd when the beat drops at a Daft Punk concert.
Our View
The good news is that Under Armour's demonstrated ability to convert EBIT to free cash flow delights us like a fluffy puppy does a toddler. And the good news does not stop there, as its EBIT growth rate also supports that impression! Zooming out, Under Armour seems to use debt quite reasonably; and that gets the nod from us. After all, sensible leverage can boost returns on equity. Over time, share prices tend to follow earnings per share, so if you're interested in Under Armour, you may well want to click here to check an interactive graph of its earnings per share history.
If you're interested in investing in businesses that can grow profits without the burden of debt, then check out this free list of growing businesses that have net cash on the balance sheet.
We aim to bring you long-term focused research analysis driven by fundamental data. Note that our analysis may not factor in the latest price-sensitive company announcements or qualitative material.
If you spot an error that warrants correction, please contact the editor at editorial-team@simplywallst.com. This article by Simply Wall St is general in nature. It does not constitute a recommendation to buy or sell any stock, and does not take account of your objectives, or your financial situation. Simply Wall St has no position in the stocks mentioned. Thank you for reading.
About NYSE:UAA
Under Armour
Engages designs, developing, marketing, and distributing performance apparel, footwear, and accessories for men, women, and youth.
Fair value with moderate growth potential.
Similar Companies
Market Insights


Advertisement
Weekly Picks
LO


Lou_Basenese on Optimi Health ·
The Only Psychedelic Company Already Selling MDMA and Psilocybin to Real Patients, Yet Priced Like It Doesn’t Exist
Fair Value:US$1157.5% undervalued
41 followersusers have followed this narrative
2 commentsusers have commented on this narrative
6 likesusers have liked this narrative
WE


WealthAP on Novo Nordisk ·
Novo Nordisk (NVO): Is the "Easy Growth" Story Over?
Fair Value:DKK 407.7721.4% undervalued
61 followersusers have followed this narrative
0 commentsusers have commented on this narrative
8 likesusers have liked this narrative
VA


ValueInvestingSubstack on Zoetis ·
Zoetis down -50% over the past year
Fair Value:US$92.9218.9% undervalued
20 followersusers have followed this narrative
0 commentsusers have commented on this narrative
8 likesusers have liked this narrative
CE


CentryResearch on Centrus Energy ·
Centrus Energy: The Next Nuclear Bottleneck Isn't Reactors. It's Fuel.
Fair Value:US$19013.7% undervalued
22 followersusers have followed this narrative
0 commentsusers have commented on this narrative
9 likesusers have liked this narrative
Recently Updated Narratives
JA


Jamesiskindacool on Woodside Energy Group ·
Does WDS Have More in the Tank?
Fair Value:AU$36.611.6% undervalued
1 followerusers have followed this narrative
0 commentsusers have commented on this narrative
0 likesusers have liked this narrative
JA

Jamesiskindacool on Treasury Wine Estates ·
Is TWE Aging Well?
Fair Value:AU$7.0733.1% undervalued
1 followerusers have followed this narrative
0 commentsusers have commented on this narrative
0 likesusers have liked this narrative
JA

Jamesiskindacool on Transurban Group ·
Is TCL Worth the Toll?
Fair Value:AU$14.252.0% overvalued
1 followerusers have followed this narrative
0 commentsusers have commented on this narrative
0 likesusers have liked this narrative
Popular Narratives
CU

CubanEros on Microsoft ·
A wonderful business at reasonable price.
Fair Value:US$419.919.1% undervalued
77 followersusers have followed this narrative
0 commentsusers have commented on this narrative
5 likesusers have liked this narrative
BE

benjamin_lvieq on PayPal Holdings ·
PayPal: PayPal Doesn't Need to Grow – It Needs to Stop Falling – A Mispriced Cash Machine With a Cannibal Buyback
Fair Value:US$6513.6% undervalued
71 followersusers have followed this narrative
2 commentsusers have commented on this narrative
11 likesusers have liked this narrative
OS


oscargarcia on NVIDIA ·
The company that went from selling GPUs to gamers to becoming the AI arms dealer of the 21st century.
Fair Value:US$28026.1% undervalued
180 followersusers have followed this narrative
9 commentsusers have commented on this narrative
15 likesusers have liked this narrative