Is There More To The Story Than Novo Nordisk's (CPH:NOVO B) Earnings Growth?

It might be old fashioned, but we really like to invest in companies that make a profit, each and every year. That said, the current statutory profit is not always a good guide to a company's underlying profitability. In this article, we'll look at how useful this year's statutory profit is, when analysing Novo Nordisk (CPH:NOVO B).
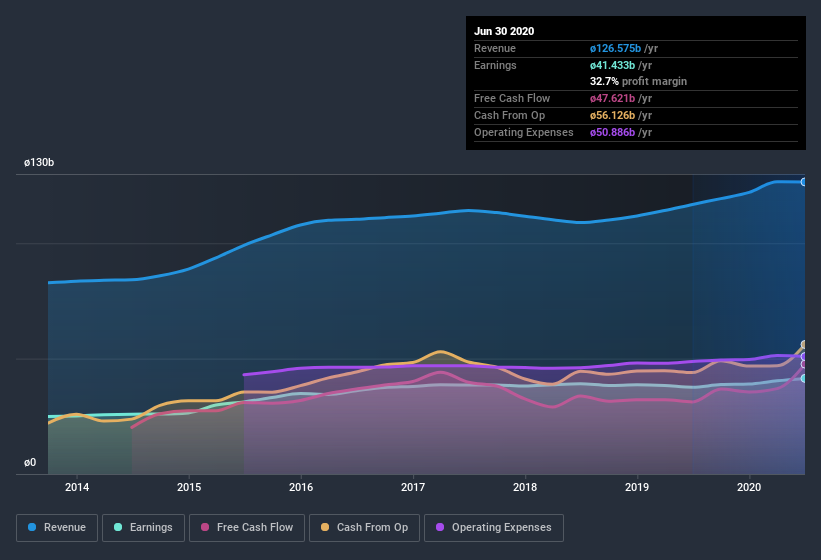
While Novo Nordisk was able to generate revenue of kr.126.6b in the last twelve months, we think its profit result of kr.41.4b was more important. Happily, it has grown both its profit and revenue over the last three years, as you can see in the chart below.
See our latest analysis for Novo Nordisk
Importantly, statutory profits are not always the best tool for understanding a company's true earnings power, so it's well worth examining profits in a little more detail. So today we'll look at what Novo Nordisk's cashflow tells us about the quality of its earnings. That might leave you wondering what analysts are forecasting in terms of future profitability. Luckily, you can click here to see an interactive graph depicting future profitability, based on their estimates.
A Closer Look At Novo Nordisk's Earnings
One key financial ratio used to measure how well a company converts its profit to free cash flow (FCF) is the accrual ratio. The accrual ratio subtracts the FCF from the profit for a given period, and divides the result by the average operating assets of the company over that time. The ratio shows us how much a company's profit exceeds its FCF.
As a result, a negative accrual ratio is a positive for the company, and a positive accrual ratio is a negative. While it's not a problem to have a positive accrual ratio, indicating a certain level of non-cash profits, a high accrual ratio is arguably a bad thing, because it indicates paper profits are not matched by cash flow. To quote a 2014 paper by Lewellen and Resutek, "firms with higher accruals tend to be less profitable in the future".
Over the twelve months to June 2020, Novo Nordisk recorded an accrual ratio of -0.16. Therefore, its statutory earnings were very significantly less than its free cashflow. In fact, it had free cash flow of kr.48b in the last year, which was a lot more than its statutory profit of kr.41.4b. Novo Nordisk's free cash flow improved over the last year, which is generally good to see.
Our Take On Novo Nordisk's Profit Performance
Novo Nordisk's accrual ratio is solid, and indicates strong free cash flow, as we discussed, above. Because of this, we think Novo Nordisk's earnings potential is at least as good as it seems, and maybe even better! And the EPS is up 14% annually, over the last three years. The goal of this article has been to assess how well we can rely on the statutory earnings to reflect the company's potential, but there is plenty more to consider. Keep in mind, when it comes to analysing a stock it's worth noting the risks involved. For example - Novo Nordisk has 1 warning sign we think you should be aware of.
Today we've zoomed in on a single data point to better understand the nature of Novo Nordisk's profit. But there is always more to discover if you are capable of focussing your mind on minutiae. For example, many people consider a high return on equity as an indication of favorable business economics, while others like to 'follow the money' and search out stocks that insiders are buying. So you may wish to see this free collection of companies boasting high return on equity, or this list of stocks that insiders are buying.
If you decide to trade Novo Nordisk, use the lowest-cost* platform that is rated #1 Overall by Barron’s, Interactive Brokers. Trade stocks, options, futures, forex, bonds and funds on 135 markets, all from a single integrated account. Promoted
The New Payments ETF Is Live on NASDAQ:
Money is moving to real-time rails, and a newly listed ETF now gives investors direct exposure. Fast settlement. Institutional custody. Simple access.
Explore how this launch could reshape portfolios
Sponsored ContentValuation is complex, but we're here to simplify it.
Discover if Novo Nordisk might be undervalued or overvalued with our detailed analysis, featuring fair value estimates, potential risks, dividends, insider trades, and its financial condition.
Access Free AnalysisThis article by Simply Wall St is general in nature. It does not constitute a recommendation to buy or sell any stock, and does not take account of your objectives, or your financial situation. We aim to bring you long-term focused analysis driven by fundamental data. Note that our analysis may not factor in the latest price-sensitive company announcements or qualitative material. Simply Wall St has no position in any stocks mentioned.
*Interactive Brokers Rated Lowest Cost Broker by StockBrokers.com Annual Online Review 2020
Have feedback on this article? Concerned about the content? Get in touch with us directly. Alternatively, email editorial-team@simplywallst.com.
About CPSE:NOVO B
Novo Nordisk
Engages in the research and development, manufacture, and distribution of pharmaceutical products in Europe, the Middle East, Africa, Mainland China, Hong Kong, Taiwan, North America, and internationally.
Undervalued average dividend payer.
Similar Companies
Market Insights

Weekly Picks

Early mover in a fast growing industry. Likely to experience share price volatility as they scale


A case for CA$31.80 (undiluted), aka 8,616% upside from CA$0.37 (an 86 bagger!).


Moderation and Stabilisation: HOLD: Fair Price based on a 4-year Cycle is $12.08
Recently Updated Narratives

Airbnb Stock: Platform Growth in a World of Saturation and Scrutiny

Adobe Stock: AI-Fueled ARR Growth Pushes Guidance Higher, But Cost Pressures Loom

Thomson Reuters Stock: When Legal Intelligence Becomes Mission-Critical Infrastructure
Popular Narratives


Crazy Undervalued 42 Baggers Silver Play (Active & Running Mine)


NVDA: Expanding AI Demand Will Drive Major Data Center Investments Through 2026

The AI Infrastructure Giant Grows Into Its Valuation
Trending Discussion


