
Advertisement
David Iben put it well when he said, 'Volatility is not a risk we care about. What we care about is avoiding the permanent loss of capital. When we think about how risky a company is, we always like to look at its use of debt, since debt overload can lead to ruin. As with many other companies ICON Public Limited Company (NASDAQ:ICLR) makes use of debt. But should shareholders be worried about its use of debt?
When Is Debt Dangerous?
Debt is a tool to help businesses grow, but if a business is incapable of paying off its lenders, then it exists at their mercy. Ultimately, if the company can't fulfill its legal obligations to repay debt, shareholders could walk away with nothing. While that is not too common, we often do see indebted companies permanently diluting shareholders because lenders force them to raise capital at a distressed price. Of course, the upside of debt is that it often represents cheap capital, especially when it replaces dilution in a company with the ability to reinvest at high rates of return. The first step when considering a company's debt levels is to consider its cash and debt together.
View our latest analysis for ICON
What Is ICON's Debt?
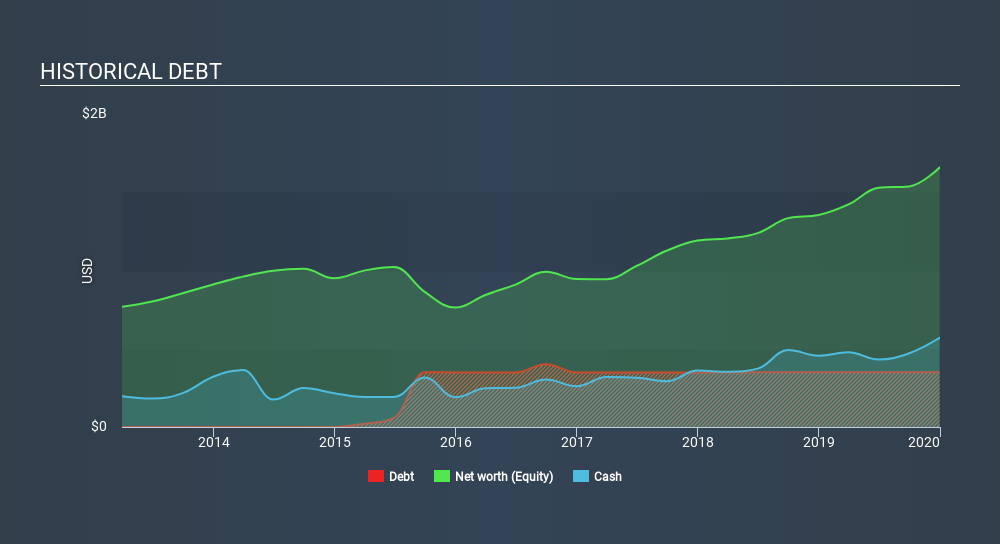
The chart below, which you can click on for greater detail, shows that ICON had US$349.6m in debt in December 2019; about the same as the year before. However, it does have US$569.9m in cash offsetting this, leading to net cash of US$220.3m.
How Strong Is ICON's Balance Sheet?
We can see from the most recent balance sheet that ICON had liabilities of US$1.13b falling due within a year, and liabilities of US$118.7m due beyond that. On the other hand, it had cash of US$569.9m and US$1.01b worth of receivables due within a year. So it can boast US$333.5m more liquid assets than total liabilities.
This short term liquidity is a sign that ICON could probably pay off its debt with ease, as its balance sheet is far from stretched. Succinctly put, ICON boasts net cash, so it's fair to say it does not have a heavy debt load!
Also good is that ICON grew its EBIT at 12% over the last year, further increasing its ability to manage debt. The balance sheet is clearly the area to focus on when you are analysing debt. But it is future earnings, more than anything, that will determine ICON's ability to maintain a healthy balance sheet going forward. So if you want to see what the professionals think, you might find this free report on analyst profit forecasts to be interesting.
Finally, while the tax-man may adore accounting profits, lenders only accept cold hard cash. While ICON has net cash on its balance sheet, it's still worth taking a look at its ability to convert earnings before interest and tax (EBIT) to free cash flow, to help us understand how quickly it is building (or eroding) that cash balance. Over the most recent three years, ICON recorded free cash flow worth 79% of its EBIT, which is around normal, given free cash flow excludes interest and tax. This cold hard cash means it can reduce its debt when it wants to.
Summing up
While we empathize with investors who find debt concerning, you should keep in mind that ICON has net cash of US$220.3m, as well as more liquid assets than liabilities. The cherry on top was that in converted 79% of that EBIT to free cash flow, bringing in US$362m. So is ICON's debt a risk? It doesn't seem so to us. Over time, share prices tend to follow earnings per share, so if you're interested in ICON, you may well want to click here to check an interactive graph of its earnings per share history.
If, after all that, you're more interested in a fast growing company with a rock-solid balance sheet, then check out our list of net cash growth stocks without delay.
If you spot an error that warrants correction, please contact the editor at editorial-team@simplywallst.com. This article by Simply Wall St is general in nature. It does not constitute a recommendation to buy or sell any stock, and does not take account of your objectives, or your financial situation. Simply Wall St has no position in the stocks mentioned.
We aim to bring you long-term focused research analysis driven by fundamental data. Note that our analysis may not factor in the latest price-sensitive company announcements or qualitative material. Thank you for reading.
About NasdaqGS:ICLR
ICON
A clinical research organization, provides outsourced development and commercialization services in Ireland, rest of Europe, the United States, and internationally.
Very undervalued with proven track record.
Similar Companies
Market Insights

Advertisement
Community Narratives
Vita Life Sciences Set for a 12.72% Revenue Growth While Tackling Operational Challenges
Fair Value AU$2.42|8.7% undervalued
RO
Community Contributor
Vossloh rides a €500 billion wave to boost growth and earnings in the next decade
Fair Value €78.41|6.3% undervalued
CH
Community Contributor
Intuitive Surgical Will Transform Healthcare with 12% Revenue Growth
Fair Value US$325.55|56.5% overvalued
UN
Community Contributor