Advertisement
- Canada
- /
- Energy Services
- /
- TSX:ESI
Is Ensign Energy Services (TSE:ESI) Using Too Much Debt?
Warren Buffett famously said, 'Volatility is far from synonymous with risk.' So it seems the smart money knows that debt - which is usually involved in bankruptcies - is a very important factor, when you assess how risky a company is. As with many other companies Ensign Energy Services Inc. (TSE:ESI) makes use of debt. But is this debt a concern to shareholders?
Why Does Debt Bring Risk?
Debt and other liabilities become risky for a business when it cannot easily fulfill those obligations, either with free cash flow or by raising capital at an attractive price. Part and parcel of capitalism is the process of 'creative destruction' where failed businesses are mercilessly liquidated by their bankers. However, a more frequent (but still costly) occurrence is where a company must issue shares at bargain-basement prices, permanently diluting shareholders, just to shore up its balance sheet. Of course, plenty of companies use debt to fund growth, without any negative consequences. When we think about a company's use of debt, we first look at cash and debt together.
Check out our latest analysis for Ensign Energy Services
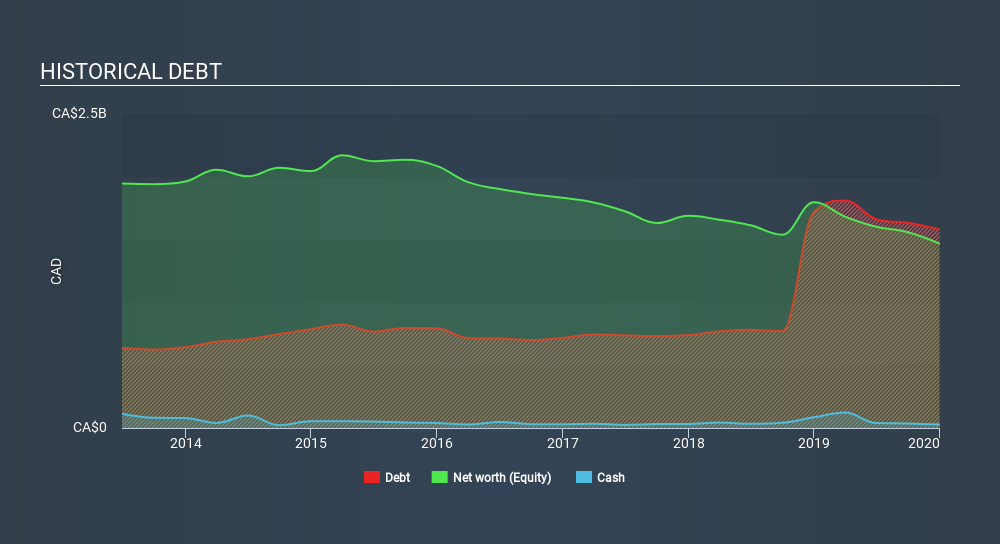
What Is Ensign Energy Services's Debt?
The image below, which you can click on for greater detail, shows that Ensign Energy Services had debt of CA$1.58b at the end of December 2019, a reduction from CA$1.72b over a year. And it doesn't have much cash, so its net debt is about the same.
How Strong Is Ensign Energy Services's Balance Sheet?
Zooming in on the latest balance sheet data, we can see that Ensign Energy Services had liabilities of CA$241.3m due within 12 months and liabilities of CA$1.76b due beyond that. Offsetting this, it had CA$28.4m in cash and CA$273.8m in receivables that were due within 12 months. So it has liabilities totalling CA$1.70b more than its cash and near-term receivables, combined.
The deficiency here weighs heavily on the CA$106.0m company itself, as if a child were struggling under the weight of an enormous back-pack full of books, his sports gear, and a trumpet. So we definitely think shareholders need to watch this one closely. At the end of the day, Ensign Energy Services would probably need a major re-capitalization if its creditors were to demand repayment.
We use two main ratios to inform us about debt levels relative to earnings. The first is net debt divided by earnings before interest, tax, depreciation, and amortization (EBITDA), while the second is how many times its earnings before interest and tax (EBIT) covers its interest expense (or its interest cover, for short). The advantage of this approach is that we take into account both the absolute quantum of debt (with net debt to EBITDA) and the actual interest expenses associated with that debt (with its interest cover ratio).
While Ensign Energy Services's debt to EBITDA ratio (4.0) suggests that it uses some debt, its interest cover is very weak, at 0.19, suggesting high leverage. It seems that the business incurs large depreciation and amortisation charges, so maybe its debt load is heavier than it would first appear, since EBITDA is arguably a generous measure of earnings. So shareholders should probably be aware that interest expenses appear to have really impacted the business lately. However, the silver lining was that Ensign Energy Services achieved a positive EBIT of CA$29m in the last twelve months, an improvement on the prior year's loss. The balance sheet is clearly the area to focus on when you are analysing debt. But it is future earnings, more than anything, that will determine Ensign Energy Services's ability to maintain a healthy balance sheet going forward. So if you're focused on the future you can check out this free report showing analyst profit forecasts.
Finally, a company can only pay off debt with cold hard cash, not accounting profits. So it is important to check how much of its earnings before interest and tax (EBIT) converts to actual free cash flow. Over the last year, Ensign Energy Services actually produced more free cash flow than EBIT. There's nothing better than incoming cash when it comes to staying in your lenders' good graces.
Our View
To be frank both Ensign Energy Services's interest cover and its track record of staying on top of its total liabilities make us rather uncomfortable with its debt levels. But on the bright side, its conversion of EBIT to free cash flow is a good sign, and makes us more optimistic. Looking at the bigger picture, it seems clear to us that Ensign Energy Services's use of debt is creating risks for the company. If everything goes well that may pay off but the downside of this debt is a greater risk of permanent losses. When analysing debt levels, the balance sheet is the obvious place to start. But ultimately, every company can contain risks that exist outside of the balance sheet. Case in point: We've spotted 4 warning signs for Ensign Energy Services you should be aware of, and 1 of them is concerning.
Of course, if you're the type of investor who prefers buying stocks without the burden of debt, then don't hesitate to discover our exclusive list of net cash growth stocks, today.
If you spot an error that warrants correction, please contact the editor at editorial-team@simplywallst.com. This article by Simply Wall St is general in nature. It does not constitute a recommendation to buy or sell any stock, and does not take account of your objectives, or your financial situation. Simply Wall St has no position in the stocks mentioned.
We aim to bring you long-term focused research analysis driven by fundamental data. Note that our analysis may not factor in the latest price-sensitive company announcements or qualitative material. Thank you for reading.
About TSX:ESI
Ensign Energy Services
Provides oilfield services to the oil and natural gas industries in Canada, the United States, and internationally.
Undervalued with adequate balance sheet.
Similar Companies
Market Insights


Advertisement
Weekly Picks
ST


stuart_roberts on Upside Gold ·
An Undervalued 3.3Moz Gold Project in Canada
Fair Value:CA$5.0776.3% undervalued
83 followersusers have followed this narrative
0 commentsusers have commented on this narrative
14 likesusers have liked this narrative
YA

Yang_ on SoFi Technologies ·
SoFi Technologies: The Apex Aggregator and the Infrastructure of the Modern Financial System
Fair Value:US$22.9820.4% undervalued
8 followersusers have followed this narrative
0 commentsusers have commented on this narrative
4 likesusers have liked this narrative
KO

Kouj on CSL ·
CSL: The Dip Is the Opportunity
Fair Value:AU$1556.7% undervalued
6 followersusers have followed this narrative
0 commentsusers have commented on this narrative
3 likesusers have liked this narrative
GA

GavrielH on DHT Holdings ·
DHT Holdings, inc: Strait of Hormuz Risk Amidst US-Israel vs Iran Tensions Spikes VLCC Rates.
Fair Value:US$3648.3% undervalued
2 followersusers have followed this narrative
0 commentsusers have commented on this narrative
3 likesusers have liked this narrative
Recently Updated Narratives
CF


CFFF on DroneShield ·
DroneShield's Growth Will Drive Revenue Up by 25.39% Amidst New Success
Fair Value:AU$1.36195.6% overvalued
2 followersusers have followed this narrative
0 commentsusers have commented on this narrative
0 likesusers have liked this narrative
VE

Vestra on UiPath ·
UiPath Inc. (PATH): Agentic AI Pivot and Milestone Profits Set the Stage for Q4 Results
Fair Value:US$19.6841.1% undervalued
1 followerusers have followed this narrative
0 commentsusers have commented on this narrative
0 likesusers have liked this narrative
VE

Vestra on AeroVironment ·
AeroVironment (AVAV): Q3 Earnings Miss Balanced by Record Backlog and BlueHalo Integration
Fair Value:US$28722.8% undervalued
3 followersusers have followed this narrative
0 commentsusers have commented on this narrative
0 likesusers have liked this narrative
Popular Narratives
KA

kabz2342 on Nu Holdings ·
Nu holdings will continue to disrupt the South American banking market
Fair Value:US$64.376.9% undervalued
51 followersusers have followed this narrative
3 commentsusers have commented on this narrative
27 likesusers have liked this narrative
AN


AnalystConsensusTarget on Microsoft ·
Analyst Commentary Highlights Microsoft AI Momentum and Upward Valuation Amid Growth and Competitive Risks
Fair Value:US$59631.9% undervalued
1306 followersusers have followed this narrative
2 commentsusers have commented on this narrative
10 likesusers have liked this narrative
AN

AnalystConsensusTarget on NVIDIA ·
NVDA: Expanding AI Demand Will Drive Major Data Center Investments Through 2026
Fair Value:US$253.0227.0% undervalued
1102 followersusers have followed this narrative
7 commentsusers have commented on this narrative
34 likesusers have liked this narrative


