
Advertisement
If you want to know who really controls Altice Europe N.V. (AMS:ATC), then you'll have to look at the makeup of its share registry. Institutions often own shares in more established companies, while it's not unusual to see insiders own a fair bit of smaller companies. We also tend to see lower insider ownership in companies that were previously publicly owned.
Altice Europe has a market capitalization of €7.1b, so it's too big to fly under the radar. We'd expect to see both institutions and retail investors owning a portion of the company. Our analysis of the ownership of the company, below, shows that institutions are noticeable on the share registry. Let's delve deeper into each type of owner, to discover more about Altice Europe.
View 3 warning signs we detected for Altice Europe

What Does The Institutional Ownership Tell Us About Altice Europe?
Many institutions measure their performance against an index that approximates the local market. So they usually pay more attention to companies that are included in major indices.
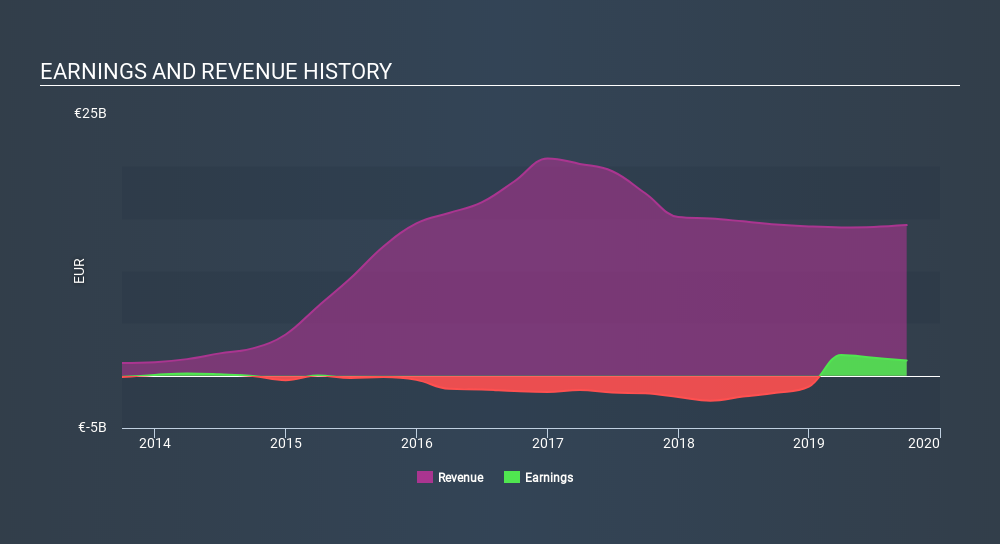
Altice Europe already has institutions on the share registry. Indeed, they own 26% of the company. This suggests some credibility amongst professional investors. But we can't rely on that fact alone, since institutions make bad investments sometimes, just like everyone does. If multiple institutions change their view on a stock at the same time, you could see the share price drop fast. It's therefore worth looking at Altice Europe's earnings history, below. Of course, the future is what really matters.
Altice Europe is not owned by hedge funds. Looking at our data, we can see that the largest shareholder is Next Alt S.a.r.l. with 49% of shares outstanding. The second largest shareholder with 8.2%, is Capital Research and Management Company, followed by FMR LLC, with an ownership of 3.9%.
Our analysis suggests that the top 2 shareholders collectively control 58% of the company's shares, implying that they have considerable power to influence the company's decisions.
While studying institutional ownership for a company can add value to your research, it is also a good practice to research analyst recommendations to get a deeper understand of a stock's expected performance. Quite a few analysts cover the stock, so you could look into forecast growth quite easily.
Insider Ownership Of Altice Europe
While the precise definition of an insider can be subjective, almost everyone considers board members to be insiders. Management ultimately answers to the board. However, it is not uncommon for managers to be executive board members, especially if they are a founder or the CEO.
Most consider insider ownership a positive because it can indicate the board is well aligned with other shareholders. However, on some occasions too much power is concentrated within this group.
We can see that insiders own shares in Altice Europe N.V.. This is a big company, so it is good to see this level of alignment. Insiders own €162m worth of shares (at current prices). It is good to see this level of investment by insiders. You can check here to see if those insiders have been buying recently.
General Public Ownership
With a 20% ownership, the general public have some degree of sway over ATC. While this group can't necessarily call the shots, it can certainly have a real influence on how the company is run.
Private Company Ownership
Our data indicates that Private Companies hold 51%, of the company's shares. It's hard to draw any conclusions from this fact alone, so its worth looking into who owns those private companies. Sometimes insiders or other related parties have an interest in shares in a public company through a separate private company.
Next Steps:
While it is well worth considering the different groups that own a company, there are other factors that are even more important.
I always like to check for a history of revenue growth. You can too, by accessing this free chart of historic revenue and earnings in this detailed graph.
Ultimately the future is most important. You can access this free report on analyst forecasts for the company.
NB: Figures in this article are calculated using data from the last twelve months, which refer to the 12-month period ending on the last date of the month the financial statement is dated. This may not be consistent with full year annual report figures.
If you spot an error that warrants correction, please contact the editor at editorial-team@simplywallst.com. This article by Simply Wall St is general in nature. It does not constitute a recommendation to buy or sell any stock, and does not take account of your objectives, or your financial situation. Simply Wall St has no position in the stocks mentioned.
We aim to bring you long-term focused research analysis driven by fundamental data. Note that our analysis may not factor in the latest price-sensitive company announcements or qualitative material. Thank you for reading.
Market Insights

Advertisement
Community Narratives
WhiteCap Is Positioned To Profit Regardless Of Trump's Policy 
Fair Value CA$22.60|61.5% undervalued
ST
Equity Analyst and Writer
Microsoft's Evolution Will Drive Revenue to New Heights Fueled by AI
Fair Value US$360.00|30.7% overvalued
BR
Community Contributor
A CASE FOR USD$2.50 (CAD$3.44) BY 2028 (A 5-10 BAGGER)
Fair Value CA$3.44|88.1% undervalued
AG
Community Contributor