Advertisement
- United States
- /
- Specialty Stores
- /
- NasdaqGS:SFIX
How Does Stitch Fix's (NASDAQ:SFIX) P/E Compare To Its Industry, After The Share Price Drop?
To the annoyance of some shareholders, Stitch Fix (NASDAQ:SFIX) shares are down a considerable 31% in the last month. That drop has capped off a tough year for shareholders, with the share price down 50% in that time.
Assuming nothing else has changed, a lower share price makes a stock more attractive to potential buyers. In the long term, share prices tend to follow earnings per share, but in the short term prices bounce around in response to short term factors (which are not always obvious). The implication here is that long term investors have an opportunity when expectations of a company are too low. One way to gauge market expectations of a stock is to look at its Price to Earnings Ratio (PE Ratio). Investors have optimistic expectations of companies with higher P/E ratios, compared to companies with lower P/E ratios.
View our latest analysis for Stitch Fix
How Does Stitch Fix's P/E Ratio Compare To Its Peers?
Stitch Fix's P/E of 40.78 indicates some degree of optimism towards the stock. You can see in the image below that the average P/E (30.1) for companies in the online retail industry is lower than Stitch Fix's P/E.
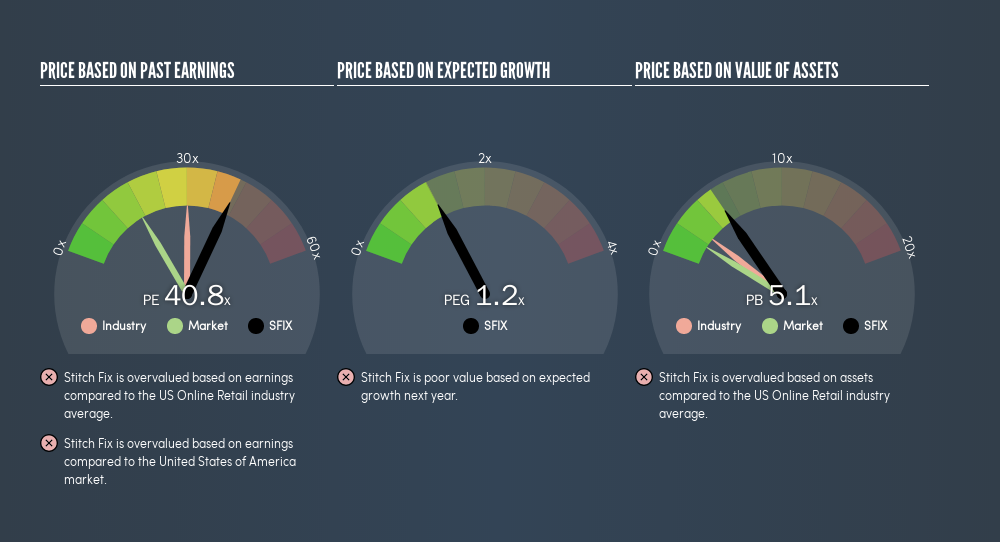
Stitch Fix's P/E tells us that market participants think the company will perform better than its industry peers, going forward.
How Growth Rates Impact P/E Ratios
Earnings growth rates have a big influence on P/E ratios. If earnings are growing quickly, then the 'E' in the equation will increase faster than it would otherwise. That means unless the share price increases, the P/E will reduce in a few years. And as that P/E ratio drops, the company will look cheap, unless its share price increases.
Stitch Fix's 52% EPS improvement over the last year was like bamboo growth after rain; rapid and impressive. Having said that, the average EPS growth over the last three years wasn't so good, coming in at 8.8%.
A Limitation: P/E Ratios Ignore Debt and Cash In The Bank
Don't forget that the P/E ratio considers market capitalization. Thus, the metric does not reflect cash or debt held by the company. Hypothetically, a company could reduce its future P/E ratio by spending its cash (or taking on debt) to achieve higher earnings.
While growth expenditure doesn't always pay off, the point is that it is a good option to have; but one that the P/E ratio ignores.
Is Debt Impacting Stitch Fix's P/E?
With net cash of US$292m, Stitch Fix has a very strong balance sheet, which may be important for its business. Having said that, at 15% of its market capitalization the cash hoard would contribute towards a higher P/E ratio.
The Bottom Line On Stitch Fix's P/E Ratio
Stitch Fix has a P/E of 40.8. That's higher than the average in its market, which is 17. The excess cash it carries is the gravy on top its fast EPS growth. So based on this analysis we'd expect Stitch Fix to have a high P/E ratio. What can be absolutely certain is that the market has become significantly less optimistic about Stitch Fix over the last month, with the P/E ratio falling from 59.2 back then to 40.8 today. For those who prefer to invest with the flow of momentum, that might be a bad sign, but for a contrarian, it may signal opportunity.
Investors have an opportunity when market expectations about a stock are wrong. If the reality for a company is better than it expects, you can make money by buying and holding for the long term. So this free visual report on analyst forecasts could hold the key to an excellent investment decision.
Of course you might be able to find a better stock than Stitch Fix. So you may wish to see this free collection of other companies that have grown earnings strongly.
We aim to bring you long-term focused research analysis driven by fundamental data. Note that our analysis may not factor in the latest price-sensitive company announcements or qualitative material.
If you spot an error that warrants correction, please contact the editor at editorial-team@simplywallst.com. This article by Simply Wall St is general in nature. It does not constitute a recommendation to buy or sell any stock, and does not take account of your objectives, or your financial situation. Simply Wall St has no position in the stocks mentioned. Thank you for reading.
About NasdaqGS:SFIX
Stitch Fix
Engages in the provision of clothing and accessories in the United States.
Flawless balance sheet and fair value.
Similar Companies
Market Insights

Advertisement
Weekly Picks
LO


Lou_Basenese on Optimi Health ·
The Only Psychedelic Company Already Selling MDMA and Psilocybin to Real Patients, Yet Priced Like It Doesn’t Exist
Fair Value:US$1158.7% undervalued
32 followersusers have followed this narrative
2 commentsusers have commented on this narrative
6 likesusers have liked this narrative
WE


WealthAP on Novo Nordisk ·
Novo Nordisk (NVO): Is the "Easy Growth" Story Over?
Fair Value:DKK 407.7721.6% undervalued
49 followersusers have followed this narrative
0 commentsusers have commented on this narrative
5 likesusers have liked this narrative
VA


ValueInvestingSubstack on Zoetis ·
Zoetis down -50% over the past year
Fair Value:US$92.9220.2% undervalued
15 followersusers have followed this narrative
0 commentsusers have commented on this narrative
7 likesusers have liked this narrative
CE


CentryResearch on Centrus Energy ·
Centrus Energy: The Next Nuclear Bottleneck Isn't Reactors. It's Fuel.
Fair Value:US$1908.3% undervalued
11 followersusers have followed this narrative
0 commentsusers have commented on this narrative
7 likesusers have liked this narrative
Recently Updated Narratives
AV

Averagemike on Samsara ·
Samsara's Future PE Will Soar to 337.7x and the Future is Bright
Fair Value:US$57.34k99.9% undervalued
1 followerusers have followed this narrative
0 commentsusers have commented on this narrative
0 likesusers have liked this narrative
JO


John_Eric on ServiceNow ·
The Company Nobody Brags About
Fair Value:US$266.0164.1% undervalued
31 followersusers have followed this narrative
0 commentsusers have commented on this narrative
0 likesusers have liked this narrative
AN


AnimalDoctorKwon on DuChemBIOLtd ·
DuChemBio absorbs Radio DNS Labs as Novartis injects 140B KRW into Korean RLT. With 100%+ OCF/EBITDA, the 6-mo lag is a de-risked steal.
Fair Value:₩10k43.5% undervalued
1 followerusers have followed this narrative
0 commentsusers have commented on this narrative
0 likesusers have liked this narrative
Popular Narratives
IN


Investingwilly on Mastercard ·
Mastercard: The Best Dividend Stock You're Ignoring
Fair Value:US$75029.1% undervalued
102 followersusers have followed this narrative
1 commentusers have commented on this narrative
9 likesusers have liked this narrative
BE

benjamin_lvieq on PayPal Holdings ·
PayPal: PayPal Doesn't Need to Grow – It Needs to Stop Falling – A Mispriced Cash Machine With a Cannibal Buyback
Fair Value:US$6514.6% undervalued
69 followersusers have followed this narrative
2 commentsusers have commented on this narrative
11 likesusers have liked this narrative
BL


BlackGoat on Cerebras Systems ·
The Wafer Giant Threatening NVIDIA's GPU Hegemony
Fair Value:US$415.5449.5% undervalued
64 followersusers have followed this narrative
3 commentsusers have commented on this narrative
11 likesusers have liked this narrative
Trending Discussion


ST


StoxEurope on Koninklijke Ahold Delhaize ·
I ran Ahold Delhaize through a three-model triangulation — DCF, dividend discount, and residual income — with every assumption published and tagged as fact or assumption. The interesting result isn't a number, it's a disagreement: the point estimates run from €20,03 (RIM) through €27,64 (DDM) to €64,91 (DCF), and the pairwise overlaps form two disjoint segments — €20,36–€21,54 and €39,60–€44,56. Between €21,54 and €39,60, no two of the three models agree. [img]https://staticm.fastcomments.com/1784197249786-1000x1000-ad-range-strip.png[/img] Most of the spread is lens properties rather than company drama. A dividend model structurally can't see the roughly half of shareholder returns Ahold pays through buybacks. The book is ~96 % goodwill from the 2016 merger, which pins the residual-income reading low. And ~83 % of the DCF's value sits beyond the explicit five years, so it leans hard on the terminal assumptions. Three honest lenses, three honest answers — the disagreement is the information. Disclosures Position disclosure: The author holds no position in Ahold Delhaize as at 9 July 2026. This valuation is a StoxEurope opinion, based on honest research. Mistakes are possible. This is not investment advice. Do your own research. This article demonstrates a valuation methodology. It is not an investment recommendation, is not personalised to any reader's circumstances, and every figure in it depends entirely on the stated assumptions
1
|0
ST

stephen_iwu3c on CK Hutchison Holdings ·
Hutchsion 3 UK has been sold to vodafone, why is there an integration costs, is the analysis outdated?
0
|0