
Advertisement
- United States
- /
- Media
- /
- NYSE:IPG
How Does Interpublic Group of Companies's (NYSE:IPG) P/E Compare To Its Industry, After The Share Price Drop?

To the annoyance of some shareholders, Interpublic Group of Companies (NYSE:IPG) shares are down a considerable 39% in the last month. Indeed the recent decline has arguably caused some bitterness for shareholders who have held through the 32% drop over twelve months.
Assuming nothing else has changed, a lower share price makes a stock more attractive to potential buyers. While the market sentiment towards a stock is very changeable, in the long run, the share price will tend to move in the same direction as earnings per share. So, on certain occasions, long term focussed investors try to take advantage of pessimistic expectations to buy shares at a better price. Perhaps the simplest way to get a read on investors' expectations of a business is to look at its Price to Earnings Ratio (PE Ratio). A high P/E implies that investors have high expectations of what a company can achieve compared to a company with a low P/E ratio.
See our latest analysis for Interpublic Group of Companies
How Does Interpublic Group of Companies's P/E Ratio Compare To Its Peers?
Interpublic Group of Companies's P/E of 8.98 indicates relatively low sentiment towards the stock. The image below shows that Interpublic Group of Companies has a lower P/E than the average (10.9) P/E for companies in the media industry.
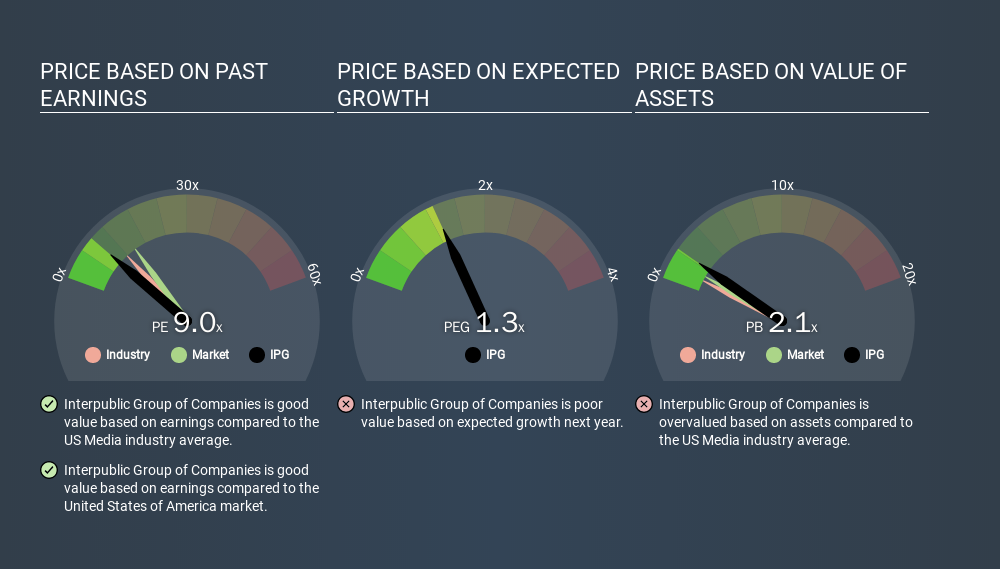
This suggests that market participants think Interpublic Group of Companies will underperform other companies in its industry. Many investors like to buy stocks when the market is pessimistic about their prospects. It is arguably worth checking if insiders are buying shares, because that might imply they believe the stock is undervalued.
How Growth Rates Impact P/E Ratios
Probably the most important factor in determining what P/E a company trades on is the earnings growth. Earnings growth means that in the future the 'E' will be higher. And in that case, the P/E ratio itself will drop rather quickly. So while a stock may look expensive based on past earnings, it could be cheap based on future earnings.
Interpublic Group of Companies saw earnings per share improve by -5.2% last year. And its annual EPS growth rate over 5 years is 8.3%.
A Limitation: P/E Ratios Ignore Debt and Cash In The Bank
It's important to note that the P/E ratio considers the market capitalization, not the enterprise value. So it won't reflect the advantage of cash, or disadvantage of debt. The exact same company would hypothetically deserve a higher P/E ratio if it had a strong balance sheet, than if it had a weak one with lots of debt, because a cashed up company can spend on growth.
Such expenditure might be good or bad, in the long term, but the point here is that the balance sheet is not reflected by this ratio.
How Does Interpublic Group of Companies's Debt Impact Its P/E Ratio?
Net debt is 36% of Interpublic Group of Companies's market cap. You'd want to be aware of this fact, but it doesn't bother us.
The Verdict On Interpublic Group of Companies's P/E Ratio
Interpublic Group of Companies trades on a P/E ratio of 9.0, which is below the US market average of 13.3. The company hasn't stretched its balance sheet, and earnings are improving. If growth is sustainable over the long term, then the current P/E ratio may be a sign of good value. Given Interpublic Group of Companies's P/E ratio has declined from 14.7 to 9.0 in the last month, we know for sure that the market is more worried about the business today, than it was back then. For those who prefer invest in growth, this stock apparently offers limited promise, but the deep value investors may find the pessimism around this stock enticing.
Investors should be looking to buy stocks that the market is wrong about. If the reality for a company is not as bad as the P/E ratio indicates, then the share price should increase as the market realizes this. So this free visualization of the analyst consensus on future earnings could help you make the right decision about whether to buy, sell, or hold.
Of course, you might find a fantastic investment by looking at a few good candidates. So take a peek at this free list of companies with modest (or no) debt, trading on a P/E below 20.
If you spot an error that warrants correction, please contact the editor at editorial-team@simplywallst.com. This article by Simply Wall St is general in nature. It does not constitute a recommendation to buy or sell any stock, and does not take account of your objectives, or your financial situation. Simply Wall St has no position in the stocks mentioned.
We aim to bring you long-term focused research analysis driven by fundamental data. Note that our analysis may not factor in the latest price-sensitive company announcements or qualitative material. Thank you for reading.
About NYSE:IPG
Interpublic Group of Companies
Provides advertising and marketing services worldwide.
Flawless balance sheet, undervalued and pays a dividend.
Similar Companies
Market Insights

Advertisement
Community Narratives
WhiteCap Is Positioned To Profit Regardless Of Trump's Policy 
Fair Value CA$22.60|61.5% undervalued
ST
Equity Analyst and Writer
Microsoft's Evolution Will Drive Revenue to New Heights Fueled by AI
Fair Value US$360.00|30.7% overvalued
BR
Community Contributor
A CASE FOR USD$2.50 (CAD$3.44) BY 2028 (A 5-10 BAGGER)
Fair Value CA$3.44|88.1% undervalued
AG
Community Contributor