
Advertisement
- United States
- /
- Banks
- /
- NasdaqGS:FULT
How Does Fulton Financial Corporation (NASDAQ:FULT) Affect Your Portfolio Volatility?

If you own shares in Fulton Financial Corporation (NASDAQ:FULT) then it's worth thinking about how it contributes to the volatility of your portfolio, overall. In finance, Beta is a measure of volatility. Volatility is considered to be a measure of risk in modern finance theory. Investors may think of volatility as falling into two main categories. The first type is company specific volatility. Investors use diversification across uncorrelated stocks to reduce this kind of price volatility across the portfolio. The other type, which cannot be diversified away, is the volatility of the entire market. Every stock in the market is exposed to this volatility, which is linked to the fact that stocks prices are correlated in an efficient market.
Some stocks mimic the volatility of the market quite closely, while others demonstrate muted, exagerrated or uncorrelated price movements. Beta is a widely used metric to measure a stock's exposure to market risk (volatility). Before we go on, it's worth noting that Warren Buffett pointed out in his 2014 letter to shareholders that 'volatility is far from synonymous with risk.' Having said that, beta can still be rather useful. The first thing to understand about beta is that the beta of the overall market is one. A stock with a beta greater than one is more sensitive to broader market movements than a stock with a beta of less than one.
View our latest analysis for Fulton Financial
What does FULT's beta value mean to investors?
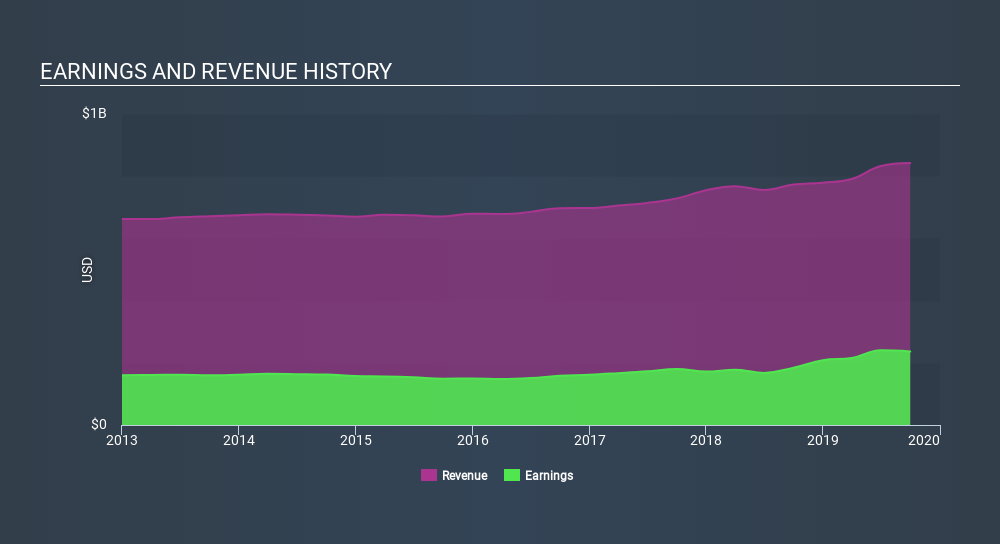
As it happens, Fulton Financial has a five year beta of 1.02. This is fairly close to 1, so the stock has historically shown a somewhat similar level of volatility as the market. Using history as a guide, we might surmise that the share price is likely to be influenced by market voltility going forward but it probably won't be particularly sensitive to it. Many would argue that beta is useful in position sizing, but fundamental metrics such as revenue and earnings are more important overall. You can see Fulton Financial's revenue and earnings in the image below.
Does FULT's size influence the expected beta?
Fulton Financial is a reasonably big company, with a market capitalisation of US$2.9b. Most companies this size are actively traded with decent volumes of shares changing hands each day. We shouldn't be surprised to see a large company like this with a beta value quite close to the market average. Large companies often move roughly in line with the market. In part, that's because there are fewer individual events that are signficant enough to markedly change the value of the stock (compared to small companies, at least).
What this means for you:
Since Fulton Financial has a beta close to one, it will probably show a positive return when the market is moving up, based on history. If you're trying to generate better returns than the market, it would be worth thinking about other metrics such as cashflows, dividends and revenue growth might be a more useful guide to the future. This article aims to educate investors about beta values, but it's well worth looking at important company-specific fundamentals such as Fulton Financial’s financial health and performance track record. I highly recommend you dive deeper by considering the following:
- Future Outlook: What are well-informed industry analysts predicting for FULT’s future growth? Take a look at our free research report of analyst consensus for FULT’s outlook.
- Past Track Record: Has FULT been consistently performing well irrespective of the ups and downs in the market? Go into more detail in the past performance analysis and take a look at the free visual representations of FULT's historicals for more clarity.
- Other Interesting Stocks: It's worth checking to see how FULT measures up against other companies on valuation. You could start with this free list of prospective options.
If you spot an error that warrants correction, please contact the editor at editorial-team@simplywallst.com. This article by Simply Wall St is general in nature. It does not constitute a recommendation to buy or sell any stock, and does not take account of your objectives, or your financial situation. Simply Wall St has no position in the stocks mentioned.
We aim to bring you long-term focused research analysis driven by fundamental data. Note that our analysis may not factor in the latest price-sensitive company announcements or qualitative material. Thank you for reading.
About NasdaqGS:FULT
Fulton Financial
Operates as the bank holding company for Fulton Bank that provides banking and financial products and services in the United States.
Flawless balance sheet, undervalued and pays a dividend.
Similar Companies
Market Insights

Advertisement
Community Narratives
The Future of Drug Testing? Fingerprint Tech Shows Serious Promise
Fair Value US$2.98|33.6% undervalued
JO
Community Contributor
Occidental Petroleum is set to achieve a 16% profit margin improvement
Fair Value US$55.05|18.5% undervalued
DZ
Community Contributor
Argan's Revenue Set to Soar with a 13.31% Growth in the Coming Decade
Fair Value US$284.68|21.2% undervalued
KE
Community Contributor
EU#1 - From German Startup to EU’s Biggest Company
Fair Value €248.62|5.8% overvalued
TO
Community Contributor