Advertisement
How Do United Carpets Group plc’s (LON:UCG) Returns Compare To Its Industry?
Today we are going to look at United Carpets Group plc (LON:UCG) to see whether it might be an attractive investment prospect. In particular, we'll consider its Return On Capital Employed (ROCE), as that can give us insight into how profitably the company is able to employ capital in its business.
First, we'll go over how we calculate ROCE. Next, we'll compare it to others in its industry. And finally, we'll look at how its current liabilities are impacting its ROCE.
What is Return On Capital Employed (ROCE)?
ROCE is a metric for evaluating how much pre-tax income (in percentage terms) a company earns on the capital invested in its business. Generally speaking a higher ROCE is better. In brief, it is a useful tool, but it is not without drawbacks. Author Edwin Whiting says to be careful when comparing the ROCE of different businesses, since 'No two businesses are exactly alike.
How Do You Calculate Return On Capital Employed?
The formula for calculating the return on capital employed is:
Return on Capital Employed = Earnings Before Interest and Tax (EBIT) ÷ (Total Assets - Current Liabilities)
Or for United Carpets Group:
0.098 = UK£588k ÷ (UK£11m - UK£5.2m) (Based on the trailing twelve months to March 2019.)
So, United Carpets Group has an ROCE of 9.8%.
See our latest analysis for United Carpets Group
Is United Carpets Group's ROCE Good?
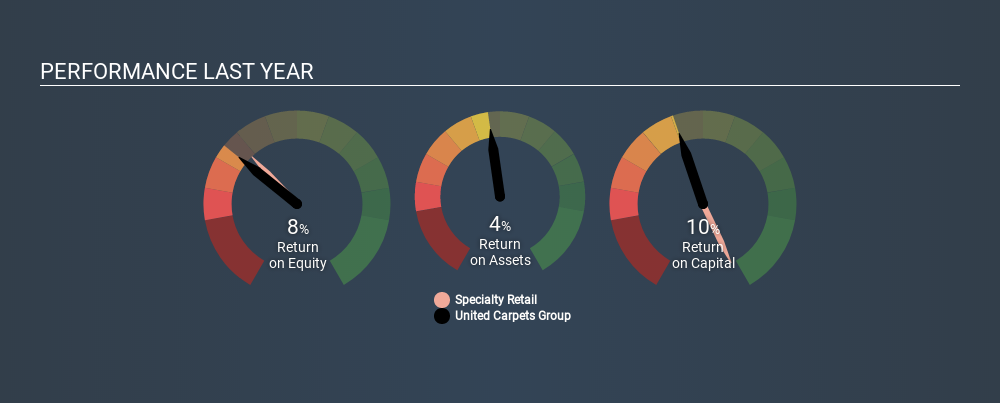
When making comparisons between similar businesses, investors may find ROCE useful. We can see United Carpets Group's ROCE is meaningfully below the Specialty Retail industry average of 14%. This could be seen as a negative, as it suggests some competitors may be employing their capital more efficiently. Independently of how United Carpets Group compares to its industry, its ROCE in absolute terms appears decent, and the company may be worthy of closer investigation.
United Carpets Group's current ROCE of 9.8% is lower than its ROCE in the past, which was 31%, 3 years ago. So investors might consider if it has had issues recently. The image below shows how United Carpets Group's ROCE compares to its industry, and you can click it to see more detail on its past growth.
It is important to remember that ROCE shows past performance, and is not necessarily predictive. ROCE can be deceptive for cyclical businesses, as returns can look incredible in boom times, and terribly low in downturns. ROCE is, after all, simply a snap shot of a single year. Since the future is so important for investors, you should check out our free report on analyst forecasts for United Carpets Group.
What Are Current Liabilities, And How Do They Affect United Carpets Group's ROCE?
Current liabilities are short term bills and invoices that need to be paid in 12 months or less. Due to the way ROCE is calculated, a high level of current liabilities makes a company look as though it has less capital employed, and thus can (sometimes unfairly) boost the ROCE. To counter this, investors can check if a company has high current liabilities relative to total assets.
United Carpets Group has total liabilities of UK£5.2m and total assets of UK£11m. Therefore its current liabilities are equivalent to approximately 46% of its total assets. United Carpets Group has a medium level of current liabilities, which would boost the ROCE.
Our Take On United Carpets Group's ROCE
With a decent ROCE, the company could be interesting, but remember that the level of current liabilities make the ROCE look better. United Carpets Group looks strong on this analysis, but there are plenty of other companies that could be a good opportunity . Here is a free list of companies growing earnings rapidly.
If you are like me, then you will not want to miss this free list of growing companies that insiders are buying.
If you spot an error that warrants correction, please contact the editor at editorial-team@simplywallst.com. This article by Simply Wall St is general in nature. It does not constitute a recommendation to buy or sell any stock, and does not take account of your objectives, or your financial situation. Simply Wall St has no position in the stocks mentioned.
We aim to bring you long-term focused research analysis driven by fundamental data. Note that our analysis may not factor in the latest price-sensitive company announcements or qualitative material. Thank you for reading.
Market Insights


Advertisement
Weekly Picks
ST


stuart_roberts on Upside Gold ·
An Undervalued 3.3Moz Gold Project in Canada
Fair Value:CA$5.0774.4% undervalued
218 followersusers have followed this narrative
1 commentusers have commented on this narrative
31 likesusers have liked this narrative
SI


SimpleMan887 on GameStop ·
GameStop will ace the financial crisis wave with its strategic Bitcoin investment and cash reserves
Fair Value:US$22089.4% undervalued
55 followersusers have followed this narrative
2 commentsusers have commented on this narrative
21 likesusers have liked this narrative
YI

yiannisz on Hesai Group ·
The First Real Lidar Winner
Fair Value:US$27.0716.3% undervalued
14 followersusers have followed this narrative
1 commentusers have commented on this narrative
4 likesusers have liked this narrative
TR


tripledub on Taiwan Semiconductor Manufacturing ·
The Most Wonderful Monopoly in the Most Dangerous Neighbourhood on Earth
Fair Value:US$3812.7% undervalued
12 followersusers have followed this narrative
0 commentsusers have commented on this narrative
13 likesusers have liked this narrative
Recently Updated Narratives
TA


Talos on 5E Advanced Materials ·
5E Advanced Materials (FEAM): A Binary Critical Minerals Play with a $6.65 Fair Value Target
Fair Value:US$6.6577.4% undervalued
1 followerusers have followed this narrative
0 commentsusers have commented on this narrative
0 likesusers have liked this narrative
53

537578 on Recursion Pharmaceuticals ·
Recursion Pharmaceuticals! WTH is going on?
Fair Value:US$1.9766.5% overvalued
8 followersusers have followed this narrative
0 commentsusers have commented on this narrative
0 likesusers have liked this narrative
RO


Robbo on Visa ·
Visa and the Case for Patience in Premium Businesses
Fair Value:US$2808.7% overvalued
1 followerusers have followed this narrative
0 commentsusers have commented on this narrative
0 likesusers have liked this narrative
Popular Narratives
TR

tripledub on Microsoft ·
Everyone's Terrified Microsoft Will Keep Spending. I'm Terrified They'll Stop.
Fair Value:US$3956.1% undervalued
45 followersusers have followed this narrative
3 commentsusers have commented on this narrative
42 likesusers have liked this narrative
RO

Robbo on Tesla ·
The academically fascinating Tesla
Fair Value:US$301.1k% overvalued
37 followersusers have followed this narrative
11 commentsusers have commented on this narrative
31 likesusers have liked this narrative
AN

AnalystConsensusTarget on Microsoft ·
Analyst Commentary Highlights Microsoft AI Momentum and Upward Valuation Amid Growth and Competitive Risks
Fair Value:US$587.3136.9% undervalued
1352 followersusers have followed this narrative
2 commentsusers have commented on this narrative
11 likesusers have liked this narrative
Trending Discussion

EL

Element1 on Greatland Resources ·
I can’t believe how inaccurate and out of date this site is—and people rely on it. Greatland owns tw...
0
|0
MI

Mikeymike on Auxly Cannabis Group ·
Id like to understand why they believe the profit margin is going decline so dramatically. Is it ene...
0
|0