
Advertisement
- United Kingdom
- /
- Commercial Services
- /
- AIM:RST
How Do Restore plc’s (LON:RST) Returns On Capital Compare To Peers?

Today we'll look at Restore plc (LON:RST) and reflect on its potential as an investment. Specifically, we'll consider its Return On Capital Employed (ROCE), since that will give us an insight into how efficiently the business can generate profits from the capital it requires.
First, we'll go over how we calculate ROCE. Then we'll compare its ROCE to similar companies. Last but not least, we'll look at what impact its current liabilities have on its ROCE.
What is Return On Capital Employed (ROCE)?
ROCE measures the 'return' (pre-tax profit) a company generates from capital employed in its business. In general, businesses with a higher ROCE are usually better quality. In brief, it is a useful tool, but it is not without drawbacks. Author Edwin Whiting says to be careful when comparing the ROCE of different businesses, since 'No two businesses are exactly alike.
So, How Do We Calculate ROCE?
Analysts use this formula to calculate return on capital employed:
Return on Capital Employed = Earnings Before Interest and Tax (EBIT) ÷ (Total Assets - Current Liabilities)
Or for Restore:
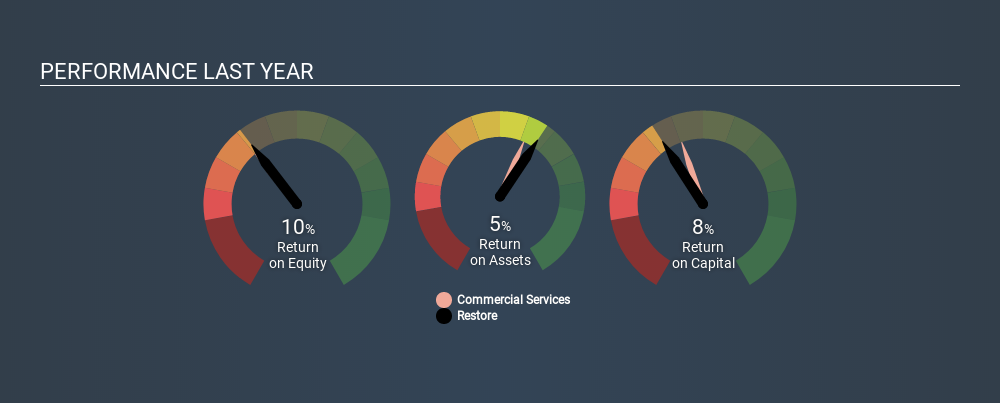
0.081 = UK£37m ÷ (UK£525m - UK£66m) (Based on the trailing twelve months to June 2019.)
So, Restore has an ROCE of 8.1%.
Check out our latest analysis for Restore
Does Restore Have A Good ROCE?
ROCE is commonly used for comparing the performance of similar businesses. Using our data, Restore's ROCE appears to be significantly below the 10% average in the Commercial Services industry. This could be seen as a negative, as it suggests some competitors may be employing their capital more efficiently. Aside from the industry comparison, Restore's ROCE is mediocre in absolute terms, considering the risk of investing in stocks versus the safety of a bank account. Readers may find more attractive investment prospects elsewhere.
You can click on the image below to see (in greater detail) how Restore's past growth compares to other companies.
Remember that this metric is backwards looking - it shows what has happened in the past, and does not accurately predict the future. ROCE can be deceptive for cyclical businesses, as returns can look incredible in boom times, and terribly low in downturns. This is because ROCE only looks at one year, instead of considering returns across a whole cycle. What happens in the future is pretty important for investors, so we have prepared a free report on analyst forecasts for Restore.
Restore's Current Liabilities And Their Impact On Its ROCE
Current liabilities are short term bills and invoices that need to be paid in 12 months or less. The ROCE equation subtracts current liabilities from capital employed, so a company with a lot of current liabilities appears to have less capital employed, and a higher ROCE than otherwise. To counter this, investors can check if a company has high current liabilities relative to total assets.
Restore has total assets of UK£525m and current liabilities of UK£66m. As a result, its current liabilities are equal to approximately 13% of its total assets. This is a modest level of current liabilities, which would only have a small effect on ROCE.
Our Take On Restore's ROCE
If Restore continues to earn an uninspiring ROCE, there may be better places to invest. You might be able to find a better investment than Restore. If you want a selection of possible winners, check out this free list of interesting companies that trade on a P/E below 20 (but have proven they can grow earnings).
If you like to buy stocks alongside management, then you might just love this free list of companies. (Hint: insiders have been buying them).
If you spot an error that warrants correction, please contact the editor at editorial-team@simplywallst.com. This article by Simply Wall St is general in nature. It does not constitute a recommendation to buy or sell any stock, and does not take account of your objectives, or your financial situation. Simply Wall St has no position in the stocks mentioned.
We aim to bring you long-term focused research analysis driven by fundamental data. Note that our analysis may not factor in the latest price-sensitive company announcements or qualitative material. Thank you for reading.
About AIM:RST
Restore
Provides secure and sustainable business services for data, information, communications, and assets primarily in the United Kingdom.
Reasonable growth potential with mediocre balance sheet.
Market Insights

Advertisement
Community Narratives
Vita Life Sciences Set for a 12.72% Revenue Growth While Tackling Operational Challenges
Fair Value AU$2.42|8.7% undervalued
RO
Community Contributor
Vossloh rides a €500 billion wave to boost growth and earnings in the next decade
Fair Value €78.41|7.2% undervalued
CH
Community Contributor
Intuitive Surgical Will Transform Healthcare with 12% Revenue Growth
Fair Value US$325.55|56.5% overvalued
UN
Community Contributor