
Advertisement
- United States
- /
- Electric Utilities
- /
- NYSE:GNE
Here's Why We Think Genie Energy's (NYSE:GNE) Statutory Earnings Might Be Conservative

Statistically speaking, it is less risky to invest in profitable companies than in unprofitable ones. That said, the current statutory profit is not always a good guide to a company's underlying profitability. Today we'll focus on whether this year's statutory profits are a good guide to understanding Genie Energy (NYSE:GNE).
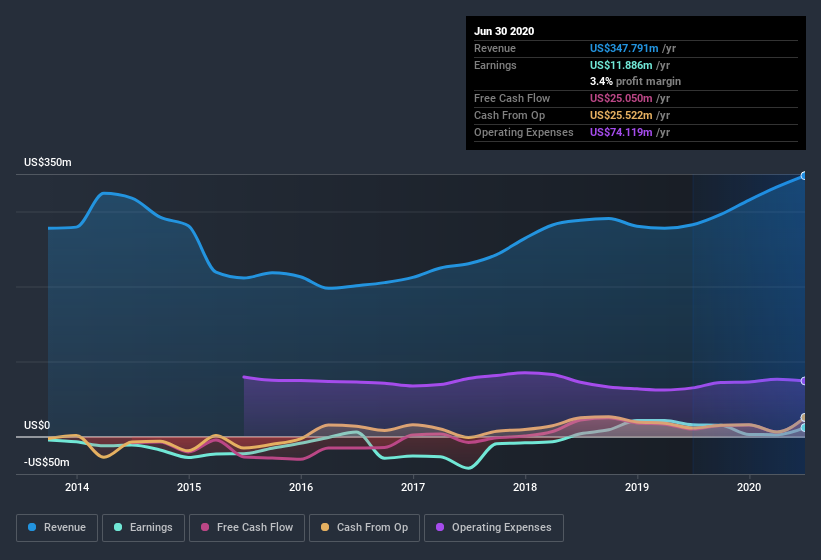
We like the fact that Genie Energy made a profit of US$11.9m on its revenue of US$347.8m, in the last year. The chart below shows that revenue has improved over the last three years, and, even better, the company has moved from unprofitable to profitable.
Check out our latest analysis for Genie Energy
Not all profits are equal, and we can learn more about the nature of a company's past profitability by diving deeper into the financial statements. Today, we'll discuss Genie Energy's free cashflow relative to its earnings, and consider what that tells us about the company. Note: we always recommend investors check balance sheet strength. Click here to be taken to our balance sheet analysis of Genie Energy.
Zooming In On Genie Energy's Earnings
In high finance, the key ratio used to measure how well a company converts reported profits into free cash flow (FCF) is the accrual ratio (from cashflow). To get the accrual ratio we first subtract FCF from profit for a period, and then divide that number by the average operating assets for the period. This ratio tells us how much of a company's profit is not backed by free cashflow.
That means a negative accrual ratio is a good thing, because it shows that the company is bringing in more free cash flow than its profit would suggest. That is not intended to imply we should worry about a positive accrual ratio, but it's worth noting where the accrual ratio is rather high. To quote a 2014 paper by Lewellen and Resutek, "firms with higher accruals tend to be less profitable in the future".
For the year to June 2020, Genie Energy had an accrual ratio of -0.24. That implies it has very good cash conversion, and that its earnings in the last year actually significantly understate its free cash flow. Indeed, in the last twelve months it reported free cash flow of US$25m, well over the US$11.9m it reported in profit. Genie Energy's free cash flow improved over the last year, which is generally good to see.
Our Take On Genie Energy's Profit Performance
Happily for shareholders, Genie Energy produced plenty of free cash flow to back up its statutory profit numbers. Based on this observation, we consider it possible that Genie Energy's statutory profit actually understates its earnings potential! Unfortunately, though, its earnings per share actually fell back over the last year. At the end of the day, it's essential to consider more than just the factors above, if you want to understand the company properly. If you want to do dive deeper into Genie Energy, you'd also look into what risks it is currently facing. For example, we've discovered 2 warning signs that you should run your eye over to get a better picture of Genie Energy.
This note has only looked at a single factor that sheds light on the nature of Genie Energy's profit. But there are plenty of other ways to inform your opinion of a company. Some people consider a high return on equity to be a good sign of a quality business. So you may wish to see this free collection of companies boasting high return on equity, or this list of stocks that insiders are buying.
If you decide to trade Genie Energy, use the lowest-cost* platform that is rated #1 Overall by Barron’s, Interactive Brokers. Trade stocks, options, futures, forex, bonds and funds on 135 markets, all from a single integrated account. Promoted
New: Manage All Your Stock Portfolios in One Place
We've created the ultimate portfolio companion for stock investors, and it's free.
• Connect an unlimited number of Portfolios and see your total in one currency
• Be alerted to new Warning Signs or Risks via email or mobile
• Track the Fair Value of your stocks
This article by Simply Wall St is general in nature. It does not constitute a recommendation to buy or sell any stock, and does not take account of your objectives, or your financial situation. We aim to bring you long-term focused analysis driven by fundamental data. Note that our analysis may not factor in the latest price-sensitive company announcements or qualitative material. Simply Wall St has no position in any stocks mentioned.
*Interactive Brokers Rated Lowest Cost Broker by StockBrokers.com Annual Online Review 2020
Have feedback on this article? Concerned about the content? Get in touch with us directly. Alternatively, email editorial-team@simplywallst.com.
About NYSE:GNE
Genie Energy
Through its subsidiaries, provides energy services in the United States and internationally.
Flawless balance sheet with solid track record.
Similar Companies
Market Insights

Advertisement
Community Narratives
The Future of Drug Testing? Fingerprint Tech Shows Serious Promise
Fair Value US$2.98|36.2% undervalued
JO
Community Contributor
Occidental Petroleum is set to achieve a 16% profit margin improvement
Fair Value US$55.05|17.7% undervalued
DZ
Community Contributor
Argan's Revenue Set to Soar with a 13.31% Growth in the Coming Decade
Fair Value US$284.68|23.2% undervalued
KE
Community Contributor
EU#1 - From German Startup to EU’s Biggest Company
Fair Value €248.62|3.6% overvalued
TO
Community Contributor