Advertisement
- United States
- /
- Oil and Gas
- /
- NasdaqGS:PDCE
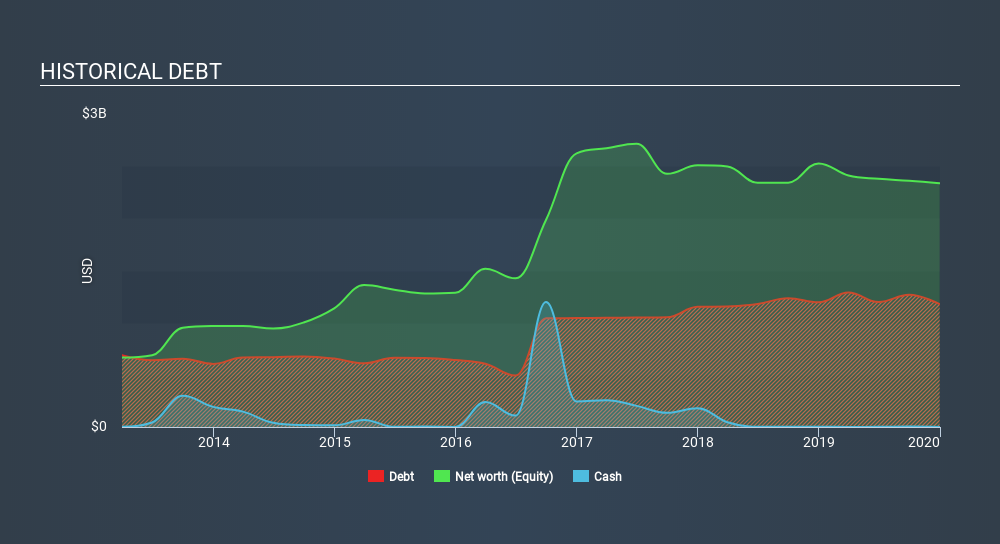
Here's Why PDC Energy (NASDAQ:PDCE) Is Weighed Down By Its Debt Load
Some say volatility, rather than debt, is the best way to think about risk as an investor, but Warren Buffett famously said that 'Volatility is far from synonymous with risk'. When we think about how risky a company is, we always like to look at its use of debt, since debt overload can lead to ruin. We note that PDC Energy, Inc. (NASDAQ:PDCE) does have debt on its balance sheet. But the real question is whether this debt is making the company risky.
Why Does Debt Bring Risk?
Debt and other liabilities become risky for a business when it cannot easily fulfill those obligations, either with free cash flow or by raising capital at an attractive price. In the worst case scenario, a company can go bankrupt if it cannot pay its creditors. While that is not too common, we often do see indebted companies permanently diluting shareholders because lenders force them to raise capital at a distressed price. By replacing dilution, though, debt can be an extremely good tool for businesses that need capital to invest in growth at high rates of return. The first thing to do when considering how much debt a business uses is to look at its cash and debt together.
View our latest analysis for PDC Energy
What Is PDC Energy's Debt?
As you can see below, PDC Energy had US$1.18b of debt, at December 2019, which is about the same as the year before. You can click the chart for greater detail. Net debt is about the same, since the it doesn't have much cash.
How Strong Is PDC Energy's Balance Sheet?
According to the last reported balance sheet, PDC Energy had liabilities of US$361.2m due within 12 months, and liabilities of US$1.75b due beyond 12 months. On the other hand, it had cash of US$963.0k and US$266.4m worth of receivables due within a year. So its liabilities outweigh the sum of its cash and (near-term) receivables by US$1.85b.
When you consider that this deficiency exceeds the company's US$1.41b market capitalization, you might well be inclined to review the balance sheet intently. In the scenario where the company had to clean up its balance sheet quickly, it seems likely shareholders would suffer extensive dilution.
We use two main ratios to inform us about debt levels relative to earnings. The first is net debt divided by earnings before interest, tax, depreciation, and amortization (EBITDA), while the second is how many times its earnings before interest and tax (EBIT) covers its interest expense (or its interest cover, for short). The advantage of this approach is that we take into account both the absolute quantum of debt (with net debt to EBITDA) and the actual interest expenses associated with that debt (with its interest cover ratio).
While PDC Energy has a quite reasonable net debt to EBITDA multiple of 1.6, its interest cover seems weak, at 0.79. In large part that's it has so much depreciation and amortisation. These charges may be non-cash, so they could be excluded when it comes to paying down debt. But the accounting charges are there for a reason -- some assets are seen to be losing value. In any case, it's safe to say the company has meaningful debt. Importantly, PDC Energy's EBIT fell a jaw-dropping 28% in the last twelve months. If that earnings trend continues then paying off its debt will be about as easy as herding cats on to a roller coaster. The balance sheet is clearly the area to focus on when you are analysing debt. But ultimately the future profitability of the business will decide if PDC Energy can strengthen its balance sheet over time. So if you're focused on the future you can check out this free report showing analyst profit forecasts.
Finally, while the tax-man may adore accounting profits, lenders only accept cold hard cash. So we clearly need to look at whether that EBIT is leading to corresponding free cash flow. Over the last two years, PDC Energy saw substantial negative free cash flow, in total. While that may be a result of expenditure for growth, it does make the debt far more risky.
Our View
On the face of it, PDC Energy's conversion of EBIT to free cash flow left us tentative about the stock, and its EBIT growth rate was no more enticing than the one empty restaurant on the busiest night of the year. But at least its net debt to EBITDA is not so bad. Taking into account all the aforementioned factors, it looks like PDC Energy has too much debt. That sort of riskiness is ok for some, but it certainly doesn't float our boat. When analysing debt levels, the balance sheet is the obvious place to start. However, not all investment risk resides within the balance sheet - far from it. For instance, we've identified 2 warning signs for PDC Energy that you should be aware of.
Of course, if you're the type of investor who prefers buying stocks without the burden of debt, then don't hesitate to discover our exclusive list of net cash growth stocks, today.
If you spot an error that warrants correction, please contact the editor at editorial-team@simplywallst.com. This article by Simply Wall St is general in nature. It does not constitute a recommendation to buy or sell any stock, and does not take account of your objectives, or your financial situation. Simply Wall St has no position in the stocks mentioned.
We aim to bring you long-term focused research analysis driven by fundamental data. Note that our analysis may not factor in the latest price-sensitive company announcements or qualitative material. Thank you for reading.
About NasdaqGS:PDCE
PDC Energy
PDC Energy, Inc., an independent exploration and production company, acquires, explores for, develops, and produces crude oil, natural gas, and natural gas liquids in the United States.
Undervalued with solid track record.
Similar Companies
Market Insights


Advertisement
Weekly Picks
CE


Ceazar on Sparc AI ·
When GPS fails: this small cap is fixing a $54B drone problem
Fair Value:US$3.8756.3% undervalued
13 followersusers have followed this narrative
0 commentsusers have commented on this narrative
3 likesusers have liked this narrative
BL


BlackGoat on IREN ·
IREN's Bold Moves in Sustainable Bitcoin Mining & AI Data Centers
Fair Value:US$71.4852.5% undervalued
212 followersusers have followed this narrative
8 commentsusers have commented on this narrative
32 likesusers have liked this narrative
HE


HedgeY on Arm Holdings ·
The Architecture Layer of AI Computing - But Priced Like the Future Already Arrived?
Fair Value:US$43043.1% undervalued
17 followersusers have followed this narrative
1 commentusers have commented on this narrative
4 likesusers have liked this narrative
HI


Hidden_Rock_Capital on Fiserv ·
Temporary "perfect storm" leads to opportunity to buy financial services leader for less than 5x long-term earnings
Fair Value:US$119.9954.8% undervalued
23 followersusers have followed this narrative
0 commentsusers have commented on this narrative
9 likesusers have liked this narrative
Recently Updated Narratives
PR


PrashhD on Aurionpro Solutions ·
Aurionpro Solutions: Is the Market Mispricing One of India's Most Interesting Fintech Product Companies?
Fair Value:₹1k27.1% undervalued
1 followerusers have followed this narrative
0 commentsusers have commented on this narrative
0 likesusers have liked this narrative
NE

newsfinder11221 on Lotus Technology ·
Lotus Technology: A Technology-Driven Luxury EV Brand with a Promising Turnaround Story
Fair Value:US$2.462.9% undervalued
1 followerusers have followed this narrative
2 commentsusers have commented on this narrative
0 likesusers have liked this narrative
ON

Ontological on Robo.ai ·
Robo.ai and Abu Dhabi Enterprise Jointly Establish AI Industrial Group Alif Holding to Serve Infrastructure, Government and Industrial Secto
Fair Value:US$0.0026117.2k% overvalued
1 followerusers have followed this narrative
0 commentsusers have commented on this narrative
0 likesusers have liked this narrative
Popular Narratives
CU

CubanEros on Microsoft ·
A wonderful business at reasonable price.
Fair Value:US$419.916.3% undervalued
93 followersusers have followed this narrative
0 commentsusers have commented on this narrative
7 likesusers have liked this narrative
OS


oscargarcia on NVIDIA ·
The company that went from selling GPUs to gamers to becoming the AI arms dealer of the 21st century.
Fair Value:US$28029.6% undervalued
207 followersusers have followed this narrative
9 commentsusers have commented on this narrative
15 likesusers have liked this narrative
BE

benjamin_lvieq on PayPal Holdings ·
PayPal: PayPal Doesn't Need to Grow – It Needs to Stop Falling – A Mispriced Cash Machine With a Cannibal Buyback
Fair Value:US$6510.3% undervalued
73 followersusers have followed this narrative
2 commentsusers have commented on this narrative
11 likesusers have liked this narrative
Trending Discussion
BL

Blegells on Terra Balcanica Resources ·
⏫42X THE AVERAGE DAILY TRADING VOLUME TODAY, JULY 28 🐂🐂🐂 FORTY-TWO!
1
|0
DE

derek_3wsdg on Teladoc Health ·
You’ve overlooked the activist investor factor. Travis Cocke’s Voss has announced 5% ownership through a 13G filing. They’ve added to that 5% since, and in doing so, have created a structural trap door for 27.42 Million Shares actively sold short. Chuck will announce lots of positives on July 29 but it’s what Voss announces shortly after that will rock the overextended Teledoc shorts. The Walmart partnership is the tip of the iceberg. The market is missing the sheer regulatory and enterprise friction of modern corporate healthcare. Teladoc isn't a "consumer app"; it is the primary digital infrastructure integrated directly into the legacy backends of Tier-1 insurance companies and fortune 500 employers, covering 105 million+ lives. Teladoc is acting as the digital top-of-funnel engine for the world's largest retailer. If Voss pushes the narrative that Teladoc is effectively the outsourced digital brain of Walmart's entire healthcare footprint, the fair value shifts from a basic health multiple to an enterprise distribution premium. Additionally , we are in a structural gold rush for high-quality, legally compliant, longitudinal medical data to train vertical healthcare AI models. Large technology hyperscalers and pharmaceutical giants cannot simply scrape the internet for this; they need structured clinical inputs. Teladoc sits on one of the largest de-identified virtual medical datasets on earth. From the activist playbook , we’ll see Voss demand the immediate creation of a Data & Diagnostics Licensing Division, transforming a legacy liability into an incredibly high-margin, pure-software data asset that requires zero human clinician hours to scale. Chuck is doing great work and deserves credi5 for the Teledoc turnaround but it will be Travis Cocke who will be responsible for a share price way beyond your $15 valuation.
1
|0
