
Advertisement
Here's What To Make Of AksharChem (India)'s (NSE:AKSHARCHEM) Returns On Capital
If you're not sure where to start when looking for the next multi-bagger, there are a few key trends you should keep an eye out for. Firstly, we'll want to see a proven return on capital employed (ROCE) that is increasing, and secondly, an expanding base of capital employed. Put simply, these types of businesses are compounding machines, meaning they are continually reinvesting their earnings back into the business at ever-higher rates of return. Although, when we looked at AksharChem (India) (NSE:AKSHARCHEM), it didn't seem to tick all of these boxes.
What is Return On Capital Employed (ROCE)?
For those who don't know, ROCE is a measure of a company's yearly pre-tax profit (its return), relative to the capital employed in the business. To calculate this metric for AksharChem (India), this is the formula:
Return on Capital Employed = Earnings Before Interest and Tax (EBIT) ÷ (Total Assets - Current Liabilities)
0.052 = ₹144m ÷ (₹3.1b - ₹382m) (Based on the trailing twelve months to December 2019).
So, AksharChem (India) has an ROCE of 5.2%. Ultimately, that's a low return and it under-performs the Chemicals industry average of 16%.
See our latest analysis for AksharChem (India)
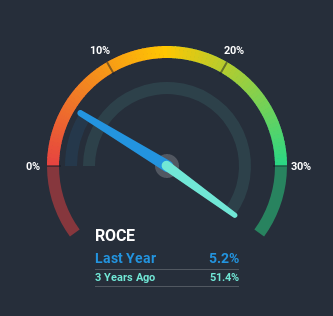
Historical performance is a great place to start when researching a stock so above you can see the gauge for AksharChem (India)'s ROCE against it's prior returns. If you want to delve into the historical earnings, revenue and cash flow of AksharChem (India), check out these free graphs here.
What The Trend Of ROCE Can Tell Us
In terms of AksharChem (India)'s historical ROCE movements, the trend isn't fantastic. Over the last five years, returns on capital have decreased to 5.2% from 32% five years ago. Given the business is employing more capital while revenue has slipped, this is a bit concerning. If this were to continue, you might be looking at a company that is trying to reinvest for growth but is actually losing market share since sales haven't increased.
On a side note, AksharChem (India) has done well to pay down its current liabilities to 12% of total assets. So we could link some of this to the decrease in ROCE. Effectively this means their suppliers or short-term creditors are funding less of the business, which reduces some elements of risk. Since the business is basically funding more of its operations with it's own money, you could argue this has made the business less efficient at generating ROCE.The Bottom Line On AksharChem (India)'s ROCE
We're a bit apprehensive about AksharChem (India) because despite more capital being deployed in the business, returns on that capital and sales have both fallen. This could explain why the stock has sunk a total of 71% in the last three years. With underlying trends that aren't great in these areas, we'd consider looking elsewhere.
One more thing to note, we've identified 5 warning signs with AksharChem (India) and understanding them should be part of your investment process.
For those who like to invest in solid companies, check out this free list of companies with solid balance sheets and high returns on equity.
If you decide to trade AksharChem (India), use the lowest-cost* platform that is rated #1 Overall by Barron’s, Interactive Brokers. Trade stocks, options, futures, forex, bonds and funds on 135 markets, all from a single integrated account.Promoted
New: Manage All Your Stock Portfolios in One Place
We've created the ultimate portfolio companion for stock investors, and it's free.
• Connect an unlimited number of Portfolios and see your total in one currency
• Be alerted to new Warning Signs or Risks via email or mobile
• Track the Fair Value of your stocks
This article by Simply Wall St is general in nature. It does not constitute a recommendation to buy or sell any stock, and does not take account of your objectives, or your financial situation. We aim to bring you long-term focused analysis driven by fundamental data. Note that our analysis may not factor in the latest price-sensitive company announcements or qualitative material. Simply Wall St has no position in any stocks mentioned.
*Interactive Brokers Rated Lowest Cost Broker by StockBrokers.com Annual Online Review 2020
Have feedback on this article? Concerned about the content? Get in touch with us directly. Alternatively, email editorial-team@simplywallst.com.
About NSEI:AKSHARCHEM
AksharChem (India)
Manufactures and sells dyes intermediates, pigments, and inorganic chemicals in India.
Adequate balance sheet with questionable track record.
Similar Companies
Market Insights

Advertisement
Community Narratives
The company that turned a verb into a global necessity and basically runs the modern internet, digital ads, smartphones, maps, and AI.
Fair Value US$300.00|10.2% undervalued
OS
Community Contributor
Flowers Foods Pays A Fair Price For Health
Fair Value US$16.12|20.3% undervalued
NV
Community Contributor
TMX Group will thrive with 33.3% profit margin and enduring market moat
Fair Value CA$49.90|0.1% undervalued
LI
Community Contributor