
Advertisement
- United Kingdom
- /
- Consumer Durables
- /
- LSE:PSN
Here's What Persimmon Plc's (LON:PSN) P/E Ratio Is Telling Us

This article is for investors who would like to improve their understanding of price to earnings ratios (P/E ratios). We'll apply a basic P/E ratio analysis to Persimmon Plc's (LON:PSN), to help you decide if the stock is worth further research. Persimmon has a P/E ratio of 9.10, based on the last twelve months. That corresponds to an earnings yield of approximately 11.0%.
Check out our latest analysis for Persimmon
How Do You Calculate A P/E Ratio?
The formula for price to earnings is:
Price to Earnings Ratio = Share Price ÷ Earnings per Share (EPS)
Or for Persimmon:
P/E of 9.10 = £25.25 ÷ £2.78 (Based on the year to June 2019.)
Is A High Price-to-Earnings Ratio Good?
A higher P/E ratio implies that investors pay a higher price for the earning power of the business. All else being equal, it's better to pay a low price -- but as Warren Buffett said, 'It's far better to buy a wonderful company at a fair price than a fair company at a wonderful price.
Does Persimmon Have A Relatively High Or Low P/E For Its Industry?
We can get an indication of market expectations by looking at the P/E ratio. The image below shows that Persimmon has a lower P/E than the average (10.9) P/E for companies in the consumer durables industry.
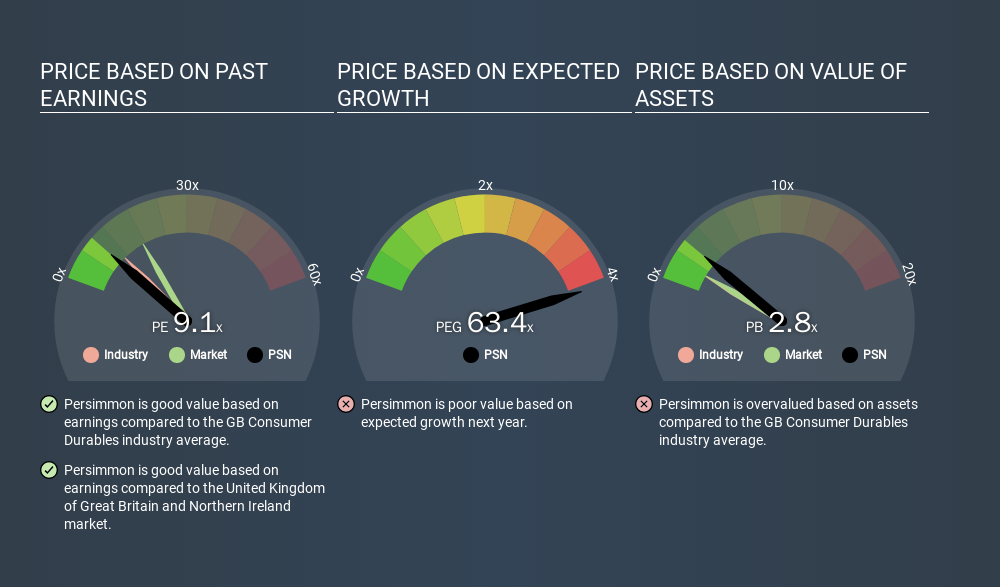
Its relatively low P/E ratio indicates that Persimmon shareholders think it will struggle to do as well as other companies in its industry classification.
How Growth Rates Impact P/E Ratios
Earnings growth rates have a big influence on P/E ratios. If earnings are growing quickly, then the 'E' in the equation will increase faster than it would otherwise. That means unless the share price increases, the P/E will reduce in a few years. A lower P/E should indicate the stock is cheap relative to others -- and that may attract buyers.
Persimmon increased earnings per share by 2.7% last year. And earnings per share have improved by 21% annually, over the last five years. Shareholders have some reason to be optimistic, but the future is always uncertain. So investors should delve deeper. I like to check if company insiders have been buying or selling.
A Limitation: P/E Ratios Ignore Debt and Cash In The Bank
One drawback of using a P/E ratio is that it considers market capitalization, but not the balance sheet. In other words, it does not consider any debt or cash that the company may have on the balance sheet. In theory, a company can lower its future P/E ratio by using cash or debt to invest in growth.
Spending on growth might be good or bad a few years later, but the point is that the P/E ratio does not account for the option (or lack thereof).
Persimmon's Balance Sheet
Persimmon has net cash of UK£833m. This is fairly high at 10% of its market capitalization. That might mean balance sheet strength is important to the business, but should also help push the P/E a bit higher than it would otherwise be.
The Verdict On Persimmon's P/E Ratio
Persimmon's P/E is 9.1 which is below average (17.3) in the GB market. EPS was up modestly better over the last twelve months. And the net cash position gives the company many options. So it's strange that the low P/E indicates low expectations.
Investors should be looking to buy stocks that the market is wrong about. As value investor Benjamin Graham famously said, 'In the short run, the market is a voting machine but in the long run, it is a weighing machine. So this free visualization of the analyst consensus on future earnings could help you make the right decision about whether to buy, sell, or hold.
You might be able to find a better buy than Persimmon. If you want a selection of possible winners, check out this free list of interesting companies that trade on a P/E below 20 (but have proven they can grow earnings).
If you spot an error that warrants correction, please contact the editor at editorial-team@simplywallst.com. This article by Simply Wall St is general in nature. It does not constitute a recommendation to buy or sell any stock, and does not take account of your objectives, or your financial situation. Simply Wall St has no position in the stocks mentioned.
We aim to bring you long-term focused research analysis driven by fundamental data. Note that our analysis may not factor in the latest price-sensitive company announcements or qualitative material. Thank you for reading.
About LSE:PSN
Flawless balance sheet and good value.
Similar Companies
Market Insights

Advertisement
Community Narratives
A case for TSXV:USA to reach USD $5.00 - $9.00 (CAD $7.30–$12.29) by 2029.
Fair Value CA$12.29|91.4% undervalued
AG
Community Contributor
DLocal's Future Growth Fueled by 35% Revenue and Profit Margin Boosts
Fair Value US$195.39|94.7% undervalued
WY
Community Contributor
Historically Cheap, but the Margin of Safety Is Still Thin
Fair Value SEK 232.58|16.0% undervalued
MA
Community Contributor