Advertisement
Today, we'll introduce the concept of the P/E ratio for those who are learning about investing. We'll apply a basic P/E ratio analysis to Ipsen S.A.'s (EPA:IPN), to help you decide if the stock is worth further research. What is Ipsen's P/E ratio? Well, based on the last twelve months it is 17.82. That corresponds to an earnings yield of approximately 5.6%.
View our latest analysis for Ipsen
How Do I Calculate A Price To Earnings Ratio?
The formula for price to earnings is:
Price to Earnings Ratio = Price per Share ÷ Earnings per Share (EPS)
Or for Ipsen:
P/E of 17.82 = €87.10 ÷ €4.89 (Based on the trailing twelve months to June 2019.)
Is A High P/E Ratio Good?
The higher the P/E ratio, the higher the price tag of a business, relative to its trailing earnings. That isn't a good or a bad thing on its own, but a high P/E means that buyers have a higher opinion of the business's prospects, relative to stocks with a lower P/E.
How Does Ipsen's P/E Ratio Compare To Its Peers?
One good way to get a quick read on what market participants expect of a company is to look at its P/E ratio. The image below shows that Ipsen has a lower P/E than the average (25.2) P/E for companies in the pharmaceuticals industry.
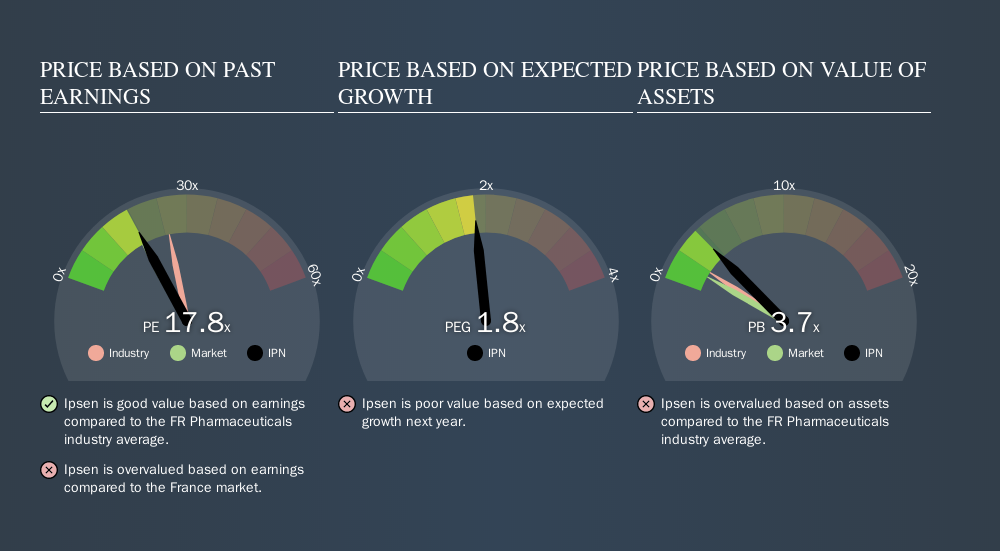
This suggests that market participants think Ipsen will underperform other companies in its industry.
How Growth Rates Impact P/E Ratios
Earnings growth rates have a big influence on P/E ratios. That's because companies that grow earnings per share quickly will rapidly increase the 'E' in the equation. That means even if the current P/E is high, it will reduce over time if the share price stays flat. And as that P/E ratio drops, the company will look cheap, unless its share price increases.
Ipsen increased earnings per share by an impressive 18% over the last twelve months. And its annual EPS growth rate over 5 years is 21%. With that performance, you might expect an above average P/E ratio. Shareholders have some reason to be optimistic, but the future is always uncertain. So investors should always consider the P/E ratio alongside other factors, such as whether company directors have been buying shares.
Don't Forget: The P/E Does Not Account For Debt or Bank Deposits
The 'Price' in P/E reflects the market capitalization of the company. That means it doesn't take debt or cash into account. Hypothetically, a company could reduce its future P/E ratio by spending its cash (or taking on debt) to achieve higher earnings.
Such spending might be good or bad, overall, but the key point here is that you need to look at debt to understand the P/E ratio in context.
So What Does Ipsen's Balance Sheet Tell Us?
Net debt totals 18% of Ipsen's market cap. This could bring some additional risk, and reduce the number of investment options for management; worth remembering if you compare its P/E to businesses without debt.
The Bottom Line On Ipsen's P/E Ratio
Ipsen's P/E is 17.8 which is about average (16.8) in the FR market. When you consider the impressive EPS growth last year (along with some debt), it seems the market has questions about whether rapid EPS growth will be sustained. Because analysts are predicting more growth in the future, one might have expected to see a higher P/E ratio. You can take a closer look at the fundamentals, here.
Investors have an opportunity when market expectations about a stock are wrong. People often underestimate remarkable growth -- so investors can make money when fast growth is not fully appreciated. So this free report on the analyst consensus forecasts could help you make a master move on this stock.
But note: Ipsen may not be the best stock to buy. So take a peek at this free list of interesting companies with strong recent earnings growth (and a P/E ratio below 20).
We aim to bring you long-term focused research analysis driven by fundamental data. Note that our analysis may not factor in the latest price-sensitive company announcements or qualitative material.
If you spot an error that warrants correction, please contact the editor at editorial-team@simplywallst.com. This article by Simply Wall St is general in nature. It does not constitute a recommendation to buy or sell any stock, and does not take account of your objectives, or your financial situation. Simply Wall St has no position in the stocks mentioned. Thank you for reading.
About ENXTPA:IPN
Ipsen
A biopharmaceutical company, develops and commercializes medicines in the areas of oncology, rare disease, and neuroscience worldwide.
Flawless balance sheet with acceptable track record.
Similar Companies
Market Insights


Advertisement
Weekly Picks
ST


stuart_roberts on Upside Gold ·
An Undervalued 3.3Moz Gold Project in Canada
Fair Value:CA$5.0777.3% undervalued
169 followersusers have followed this narrative
1 commentusers have commented on this narrative
26 likesusers have liked this narrative
CL


Clive_Thompson on Hermès International Société en commandite par actions ·
Hermès - Expensive bags, and expensive stock. And the story of €14 billion of bearer shares gone missing.
Fair Value:€1.51k10.0% overvalued
21 followersusers have followed this narrative
1 commentusers have commented on this narrative
23 likesusers have liked this narrative
SU

superbullll on Cheniere Energy ·
Cheniere Energy (LNG) — The Toll Road That Geopolitics Just Made More Valuable
Fair Value:US$320.9412.5% undervalued
22 followersusers have followed this narrative
0 commentsusers have commented on this narrative
6 likesusers have liked this narrative
SA

Salman2415 on GNG Electronics ·
Strong execution in a growing category, but long‑term value hinges on cash‑flow discipline
Fair Value:₹135.87179.9% overvalued
10 followersusers have followed this narrative
1 commentusers have commented on this narrative
2 likesusers have liked this narrative
Recently Updated Narratives
CO


composite32 on TotalEnergies ·
Is This strategic transformation of TTE? Significant re-rating potential
Fair Value:€88.2912.8% undervalued
9 followersusers have followed this narrative
2 commentsusers have commented on this narrative
0 likesusers have liked this narrative
AG


Agricola on Silver X Mining ·
A Case for Silver X reaching CAD$18 by 2031 (a possible 30 bagger)
Fair Value:CA$1896.4% undervalued
1 followerusers have followed this narrative
1 commentusers have commented on this narrative
0 likesusers have liked this narrative
VE

Vestra on Korea Electric Power ·
Korea Electric Power Corp (KEP): The Grid’s Tug-of-War – AI Demand vs. The Strait of Hormuz
Fair Value:US$32.5150.8% undervalued
2 followersusers have followed this narrative
0 commentsusers have commented on this narrative
0 likesusers have liked this narrative
Popular Narratives
KA

kabz2342 on Nu Holdings ·
Nu holdings will continue to disrupt the South American banking market
Fair Value:US$64.378.3% undervalued
55 followersusers have followed this narrative
3 commentsusers have commented on this narrative
29 likesusers have liked this narrative
YA

Yang_ on SoFi Technologies ·
SoFi Technologies: The Apex Aggregator and the Infrastructure of the Modern Financial System
Fair Value:US$22.9826.5% undervalued
47 followersusers have followed this narrative
0 commentsusers have commented on this narrative
35 likesusers have liked this narrative
PD

pdixit1 on Vertiv Holdings Co ·
The Infrastructure AI Cannot Be Built Without
Fair Value:US$408.6437.4% undervalued
39 followersusers have followed this narrative
3 commentsusers have commented on this narrative
18 likesusers have liked this narrative
Trending Discussion
OD

Oddlott on lululemon athletica ·
Thankyou for the interesting comments. So what is the world wide including USA growth rate?
0
|0
