Advertisement
- India
- /
- Consumer Durables
- /
- NSEI:IFBIND
Here's What IFB Industries Limited's (NSE:IFBIND) P/E Is Telling Us
This article is for investors who would like to improve their understanding of price to earnings ratios (P/E ratios). We'll apply a basic P/E ratio analysis to IFB Industries Limited's (NSE:IFBIND), to help you decide if the stock is worth further research. Based on the last twelve months, IFB Industries's P/E ratio is 45.24. That corresponds to an earnings yield of approximately 2.2%.
See our latest analysis for IFB Industries
How Do I Calculate IFB Industries's Price To Earnings Ratio?
The formula for price to earnings is:
Price to Earnings Ratio = Price per Share ÷ Earnings per Share (EPS)
Or for IFB Industries:
P/E of 45.24 = INR585.15 ÷ INR12.94 (Based on the year to December 2019.)
Is A High Price-to-Earnings Ratio Good?
A higher P/E ratio means that buyers have to pay a higher price for each INR1 the company has earned over the last year. That is not a good or a bad thing per se, but a high P/E does imply buyers are optimistic about the future.
Does IFB Industries Have A Relatively High Or Low P/E For Its Industry?
The P/E ratio essentially measures market expectations of a company. You can see in the image below that the average P/E (22.2) for companies in the consumer durables industry is lower than IFB Industries's P/E.
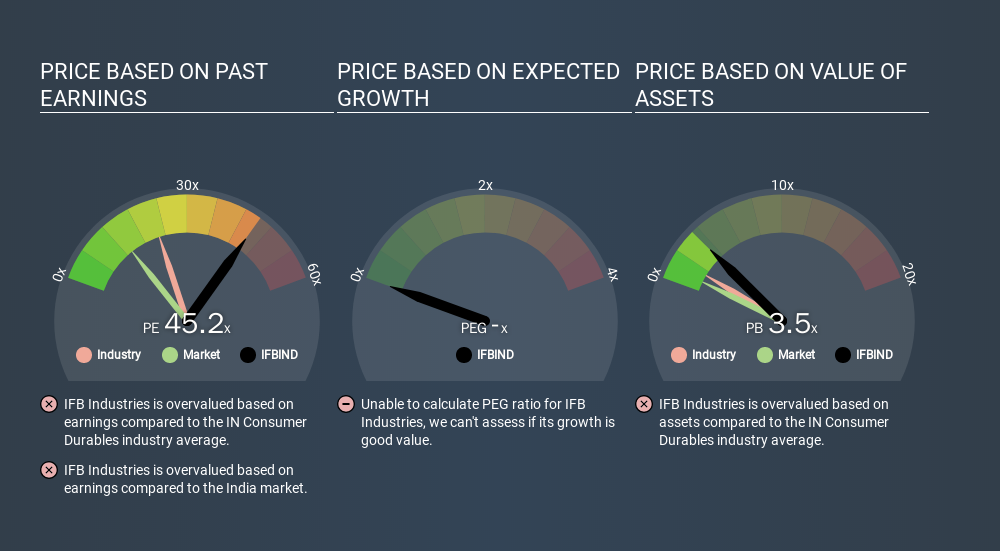
That means that the market expects IFB Industries will outperform other companies in its industry. Shareholders are clearly optimistic, but the future is always uncertain. So further research is always essential. I often monitor director buying and selling.
How Growth Rates Impact P/E Ratios
If earnings fall then in the future the 'E' will be lower. That means unless the share price falls, the P/E will increase in a few years. So while a stock may look cheap based on past earnings, it could be expensive based on future earnings.
IFB Industries's earnings per share fell by 40% in the last twelve months. And over the longer term (5 years) earnings per share have decreased 1.9% annually. This growth rate might warrant a below average P/E ratio.
A Limitation: P/E Ratios Ignore Debt and Cash In The Bank
Don't forget that the P/E ratio considers market capitalization. Thus, the metric does not reflect cash or debt held by the company. Theoretically, a business can improve its earnings (and produce a lower P/E in the future) by investing in growth. That means taking on debt (or spending its cash).
Such spending might be good or bad, overall, but the key point here is that you need to look at debt to understand the P/E ratio in context.
How Does IFB Industries's Debt Impact Its P/E Ratio?
The extra options and safety that comes with IFB Industries's ₹101m net cash position means that it deserves a higher P/E than it would if it had a lot of net debt.
The Verdict On IFB Industries's P/E Ratio
IFB Industries has a P/E of 45.2. That's significantly higher than the average in its market, which is 13.6. Falling earnings per share is probably keeping traditional value investors away, but the relatively strong balance sheet will allow the company time to invest in growth. Clearly, the high P/E indicates shareholders think it will!
Investors should be looking to buy stocks that the market is wrong about. If the reality for a company is better than it expects, you can make money by buying and holding for the long term. We don't have analyst forecasts, but you might want to assess this data-rich visualization of earnings, revenue and cash flow.
Of course, you might find a fantastic investment by looking at a few good candidates. So take a peek at this free list of companies with modest (or no) debt, trading on a P/E below 20.
If you spot an error that warrants correction, please contact the editor at editorial-team@simplywallst.com. This article by Simply Wall St is general in nature. It does not constitute a recommendation to buy or sell any stock, and does not take account of your objectives, or your financial situation. Simply Wall St has no position in the stocks mentioned.
We aim to bring you long-term focused research analysis driven by fundamental data. Note that our analysis may not factor in the latest price-sensitive company announcements or qualitative material. Thank you for reading.
About NSEI:IFBIND
IFB Industries
Manufactures and trades in home appliances in India and internationally.
Flawless balance sheet with proven track record.
Similar Companies
Market Insights

Advertisement
Weekly Picks
LO


Lou_Basenese on Optimi Health ·
The Only Psychedelic Company Already Selling MDMA and Psilocybin to Real Patients, Yet Priced Like It Doesn’t Exist
Fair Value:US$1158.7% undervalued
32 followersusers have followed this narrative
2 commentsusers have commented on this narrative
6 likesusers have liked this narrative
WE


WealthAP on Novo Nordisk ·
Novo Nordisk (NVO): Is the "Easy Growth" Story Over?
Fair Value:DKK 407.7721.6% undervalued
49 followersusers have followed this narrative
0 commentsusers have commented on this narrative
5 likesusers have liked this narrative
VA


ValueInvestingSubstack on Zoetis ·
Zoetis down -50% over the past year
Fair Value:US$92.9220.2% undervalued
15 followersusers have followed this narrative
0 commentsusers have commented on this narrative
7 likesusers have liked this narrative
CE


CentryResearch on Centrus Energy ·
Centrus Energy: The Next Nuclear Bottleneck Isn't Reactors. It's Fuel.
Fair Value:US$1908.3% undervalued
13 followersusers have followed this narrative
0 commentsusers have commented on this narrative
7 likesusers have liked this narrative
Recently Updated Narratives
RE


Reex on Unibap Space Solutions ·
Long-term bet on Europe's strategic space autonomy (2030–2055)
Fair Value:SEK 36.0176.8% undervalued
1 followerusers have followed this narrative
0 commentsusers have commented on this narrative
0 likesusers have liked this narrative
AV

Averagemike on Samsara ·
Samsara's Future PE Will Soar to 337.7x and the Future is Bright
Fair Value:US$57.34k99.9% undervalued
1 followerusers have followed this narrative
0 commentsusers have commented on this narrative
0 likesusers have liked this narrative
JO


John_Eric on ServiceNow ·
The Company Nobody Brags About
Fair Value:US$266.0164.1% undervalued
32 followersusers have followed this narrative
0 commentsusers have commented on this narrative
0 likesusers have liked this narrative
Popular Narratives
IN


Investingwilly on Mastercard ·
Mastercard: The Best Dividend Stock You're Ignoring
Fair Value:US$75029.1% undervalued
103 followersusers have followed this narrative
1 commentusers have commented on this narrative
9 likesusers have liked this narrative
BE

benjamin_lvieq on PayPal Holdings ·
PayPal: PayPal Doesn't Need to Grow – It Needs to Stop Falling – A Mispriced Cash Machine With a Cannibal Buyback
Fair Value:US$6514.6% undervalued
69 followersusers have followed this narrative
2 commentsusers have commented on this narrative
11 likesusers have liked this narrative
BL


BlackGoat on Cerebras Systems ·
The Wafer Giant Threatening NVIDIA's GPU Hegemony
Fair Value:US$415.5449.5% undervalued
64 followersusers have followed this narrative
3 commentsusers have commented on this narrative
11 likesusers have liked this narrative
Trending Discussion


PI


PittTheYounger on International Consolidated Airlines Group ·
IAG is a surefire investment in the airline space, once and if the Iran War is finally over in the sense of a lasting peace agreement or at least a reliable ceasefire. Before that, however and by the same token, IAG ranks among the most vulnerable if spring's kerosene fears return to the fore, as is very likely right now.
0
|0