Advertisement
- Canada
- /
- Specialty Stores
- /
- TSX:GBT
Here's What BMTC Group Inc.'s (TSE:GBT) P/E Ratio Is Telling Us
This article is written for those who want to get better at using price to earnings ratios (P/E ratios). We'll look at BMTC Group Inc.'s (TSE:GBT) P/E ratio and reflect on what it tells us about the company's share price. Looking at earnings over the last twelve months, BMTC Group has a P/E ratio of 10.19. That is equivalent to an earnings yield of about 9.8%.
See our latest analysis for BMTC Group
How Do I Calculate A Price To Earnings Ratio?
The formula for price to earnings is:
Price to Earnings Ratio = Share Price ÷ Earnings per Share (EPS)
Or for BMTC Group:
P/E of 10.19 = CA$10.85 ÷ CA$1.06 (Based on the trailing twelve months to April 2019.)
Is A High Price-to-Earnings Ratio Good?
The higher the P/E ratio, the higher the price tag of a business, relative to its trailing earnings. All else being equal, it's better to pay a low price -- but as Warren Buffett said, 'It's far better to buy a wonderful company at a fair price than a fair company at a wonderful price.'
Does BMTC Group Have A Relatively High Or Low P/E For Its Industry?
The P/E ratio essentially measures market expectations of a company. The image below shows that BMTC Group has a lower P/E than the average (12.3) P/E for companies in the specialty retail industry.
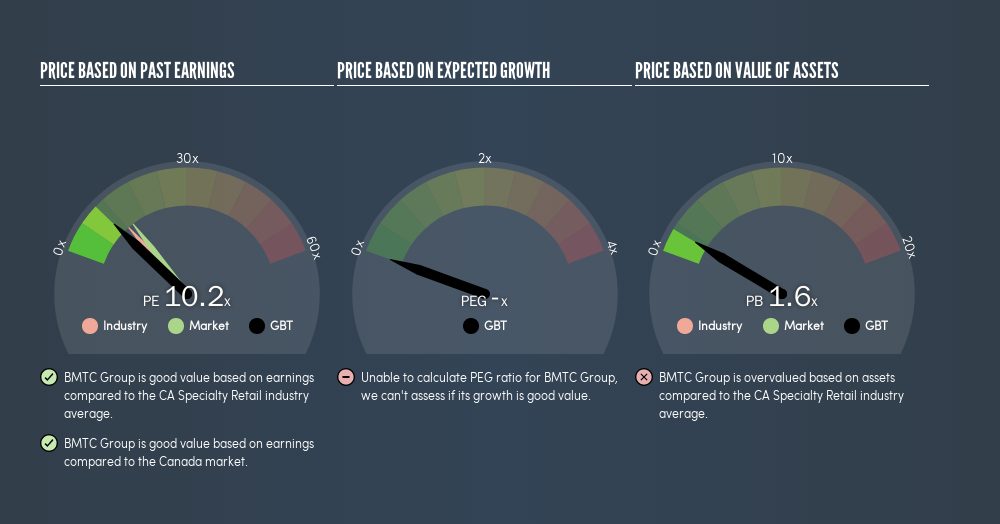
This suggests that market participants think BMTC Group will underperform other companies in its industry.
How Growth Rates Impact P/E Ratios
Earnings growth rates have a big influence on P/E ratios. That's because companies that grow earnings per share quickly will rapidly increase the 'E' in the equation. And in that case, the P/E ratio itself will drop rather quickly. A lower P/E should indicate the stock is cheap relative to others -- and that may attract buyers.
BMTC Group saw earnings per share decrease by 16% last year. But it has grown its earnings per share by 2.3% per year over the last three years. And it has shrunk its earnings per share by 2.3% per year over the last five years. This growth rate might warrant a below average P/E ratio.
A Limitation: P/E Ratios Ignore Debt and Cash In The Bank
One drawback of using a P/E ratio is that it considers market capitalization, but not the balance sheet. In other words, it does not consider any debt or cash that the company may have on the balance sheet. Hypothetically, a company could reduce its future P/E ratio by spending its cash (or taking on debt) to achieve higher earnings.
Such expenditure might be good or bad, in the long term, but the point here is that the balance sheet is not reflected by this ratio.
BMTC Group's Balance Sheet
The extra options and safety that comes with BMTC Group's CA$4.4m net cash position means that it deserves a higher P/E than it would if it had a lot of net debt.
The Bottom Line On BMTC Group's P/E Ratio
BMTC Group's P/E is 10.2 which is below average (13.9) in the CA market. The recent drop in earnings per share would make investors cautious, the relatively strong balance sheet will allow the company time to invest in growth. If it achieves that, then there's real potential that the low P/E could eventually indicate undervaluation.
When the market is wrong about a stock, it gives savvy investors an opportunity. If it is underestimating a company, investors can make money by buying and holding the shares until the market corrects itself. Although we don't have analyst forecasts, you could get a better understanding of its growth by checking out this more detailed historical graph of earnings, revenue and cash flow.
But note: BMTC Group may not be the best stock to buy. So take a peek at this free list of interesting companies with strong recent earnings growth (and a P/E ratio below 20).
We aim to bring you long-term focused research analysis driven by fundamental data. Note that our analysis may not factor in the latest price-sensitive company announcements or qualitative material.
If you spot an error that warrants correction, please contact the editor at editorial-team@simplywallst.com. This article by Simply Wall St is general in nature. It does not constitute a recommendation to buy or sell any stock, and does not take account of your objectives, or your financial situation. Simply Wall St has no position in the stocks mentioned. Thank you for reading.
About TSX:GBT
BMTC Group
Manages and operates a retail network of furniture, household appliances, and electronic products in Canada.
Excellent balance sheet average dividend payer.
Similar Companies
Market Insights


Advertisement
Weekly Picks
CE


Ceazar on Sparc AI ·
When GPS fails: this small cap is fixing a $54B drone problem
Fair Value:CA$5.2540.0% undervalued
89 followersusers have followed this narrative
0 commentsusers have commented on this narrative
22 likesusers have liked this narrative
HE


HedgeY on IonQ ·
The Best-Funded Quantum Platform and Still a Stock Priced for Perfection
Fair Value:US$482.3% overvalued
33 followersusers have followed this narrative
0 commentsusers have commented on this narrative
9 likesusers have liked this narrative
BL


BlackGoat on Cerebras Systems ·
The Wafer Giant Threatening NVIDIA's GPU Hegemony
Fair Value:US$415.5450.7% undervalued
56 followersusers have followed this narrative
1 commentusers have commented on this narrative
9 likesusers have liked this narrative
IV

Ivoed on Netflix ·
Netflix’s Business Quality Is Clear. The Harder Question Is Whether The Stock Is Still Cheap
Fair Value:US$825.3% undervalued
28 followersusers have followed this narrative
2 commentsusers have commented on this narrative
10 likesusers have liked this narrative
Recently Updated Narratives
AN


AntonioS on Medibank Private ·
Medibank Private Limited. No Margin of Safety!
Fair Value:AU$3.830.8% overvalued
1 followerusers have followed this narrative
0 commentsusers have commented on this narrative
0 likesusers have liked this narrative
MO

Momentum_Heron_abxu on Nintendo ·
Nintendo facing the Ram shortage situation
Fair Value:JP¥8k12.2% undervalued
1 followerusers have followed this narrative
0 commentsusers have commented on this narrative
0 likesusers have liked this narrative
LE

lenny67 on Agnico Eagle Mines ·
Is This Micro-Cap the Secret Solution to Agnico Eagle’s Multi-Year Production Crisis? (CSE: RFR | NYSE: AEM)
Fair Value:US$123.91k99.9% undervalued
1 followerusers have followed this narrative
0 commentsusers have commented on this narrative
0 likesusers have liked this narrative
Popular Narratives
IN


Investingwilly on Mastercard ·
Mastercard: The Best Dividend Stock You're Ignoring
Fair Value:US$75028.1% undervalued
83 followersusers have followed this narrative
1 commentusers have commented on this narrative
9 likesusers have liked this narrative
HA


HarishPK on Adobe ·
Adobe: A Probabilistic Case for Undervaluation
Fair Value:US$319.9631.3% undervalued
64 followersusers have followed this narrative
9 commentsusers have commented on this narrative
19 likesusers have liked this narrative
NI

niteco on Broadcom ·
A Capital Allocation Favorite with Structural Importance
Fair Value:US$651.0544.6% undervalued
56 followersusers have followed this narrative
0 commentsusers have commented on this narrative
13 likesusers have liked this narrative
Trending Discussion


MW

mwod31 on Greatland Resources ·
A great comment, WSB have not done the research imo. I intend to buy more shares in 2026.
0
|0