- India
- /
- Construction
- /
- NSEI:SALASAR
Has Salasar Techno Engineering Limited's (NSE:SALASAR) Impressive Stock Performance Got Anything to Do With Its Fundamentals?

Salasar Techno Engineering's (NSE:SALASAR) stock is up by a considerable 19% over the past month. We wonder if and what role the company's financials play in that price change as a company's long-term fundamentals usually dictate market outcomes. In this article, we decided to focus on Salasar Techno Engineering's ROE.
Return on equity or ROE is an important factor to be considered by a shareholder because it tells them how effectively their capital is being reinvested. Simply put, it is used to assess the profitability of a company in relation to its equity capital.
Check out our latest analysis for Salasar Techno Engineering
How Do You Calculate Return On Equity?
The formula for ROE is:
Return on Equity = Net Profit (from continuing operations) ÷ Shareholders' Equity
So, based on the above formula, the ROE for Salasar Techno Engineering is:
7.4% = ₹154m ÷ ₹2.1b (Based on the trailing twelve months to June 2020).
The 'return' is the income the business earned over the last year. So, this means that for every ₹1 of its shareholder's investments, the company generates a profit of ₹0.07.
What Has ROE Got To Do With Earnings Growth?
So far, we've learned that ROE is a measure of a company's profitability. Based on how much of its profits the company chooses to reinvest or "retain", we are then able to evaluate a company's future ability to generate profits. Generally speaking, other things being equal, firms with a high return on equity and profit retention, have a higher growth rate than firms that don’t share these attributes.
Salasar Techno Engineering's Earnings Growth And 7.4% ROE
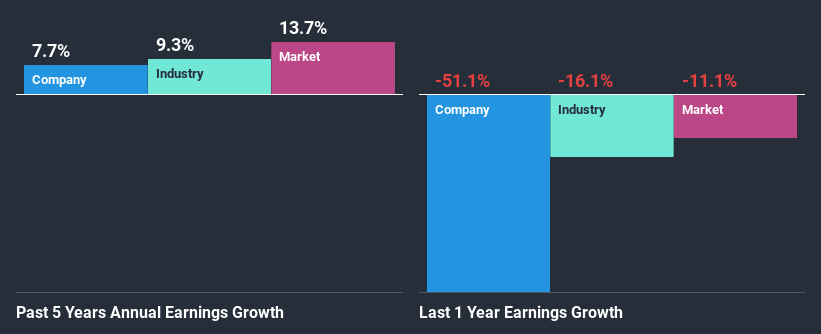
It is hard to argue that Salasar Techno Engineering's ROE is much good in and of itself. An industry comparison shows that the company's ROE is not much different from the industry average of 6.7% either. As a result, Salasar Techno Engineering's decent 7.7% net income growth seen over the past five years bodes well with us. We reckon that there could also be other factors at play that are influencing the company's growth. Such as - high earnings retention or an efficient management in place.
Next, on comparing Salasar Techno Engineering's net income growth with the industry, we found that the company's reported growth is similar to the industry average growth rate of 9.3% in the same period.
Earnings growth is an important metric to consider when valuing a stock. It’s important for an investor to know whether the market has priced in the company's expected earnings growth (or decline). This then helps them determine if the stock is placed for a bright or bleak future. If you're wondering about Salasar Techno Engineering's's valuation, check out this gauge of its price-to-earnings ratio, as compared to its industry.
Is Salasar Techno Engineering Efficiently Re-investing Its Profits?
Salasar Techno Engineering's three-year median payout ratio to shareholders is 9.3% (implying that it retains 91% of its income), which is on the lower side, so it seems like the management is reinvesting profits heavily to grow its business.
Moreover, Salasar Techno Engineering is determined to keep sharing its profits with shareholders which we infer from its long history of three years of paying a dividend.
Summary
Overall, we feel that Salasar Techno Engineering certainly does have some positive factors to consider. Even in spite of the low rate of return, the company has posted impressive earnings growth as a result of reinvesting heavily into its business. While we won't completely dismiss the company, what we would do, is try to ascertain how risky the business is to make a more informed decision around the company. To know the 4 risks we have identified for Salasar Techno Engineering visit our risks dashboard for free.
If you decide to trade Salasar Techno Engineering, use the lowest-cost* platform that is rated #1 Overall by Barron’s, Interactive Brokers. Trade stocks, options, futures, forex, bonds and funds on 135 markets, all from a single integrated account. Promoted
The New Payments ETF Is Live on NASDAQ:
Money is moving to real-time rails, and a newly listed ETF now gives investors direct exposure. Fast settlement. Institutional custody. Simple access.
Explore how this launch could reshape portfolios
Sponsored ContentNew: Manage All Your Stock Portfolios in One Place
We've created the ultimate portfolio companion for stock investors, and it's free.
• Connect an unlimited number of Portfolios and see your total in one currency
• Be alerted to new Warning Signs or Risks via email or mobile
• Track the Fair Value of your stocks
This article by Simply Wall St is general in nature. It does not constitute a recommendation to buy or sell any stock, and does not take account of your objectives, or your financial situation. We aim to bring you long-term focused analysis driven by fundamental data. Note that our analysis may not factor in the latest price-sensitive company announcements or qualitative material. Simply Wall St has no position in any stocks mentioned.
*Interactive Brokers Rated Lowest Cost Broker by StockBrokers.com Annual Online Review 2020
Have feedback on this article? Concerned about the content? Get in touch with us directly. Alternatively, email editorial-team@simplywallst.com.
About NSEI:SALASAR
Salasar Techno Engineering
Engages in the manufacture and sale of galvanized and non-galvanized steel structures in India and internationally.
Adequate balance sheet with low risk.
Similar Companies
Market Insights

Weekly Picks

Early mover in a fast growing industry. Likely to experience share price volatility as they scale


A case for CA$31.80 (undiluted), aka 8,616% upside from CA$0.37 (an 86 bagger!).


Moderation and Stabilisation: HOLD: Fair Price based on a 4-year Cycle is $12.08
Recently Updated Narratives

Airbnb Stock: Platform Growth in a World of Saturation and Scrutiny

Adobe Stock: AI-Fueled ARR Growth Pushes Guidance Higher, But Cost Pressures Loom

Thomson Reuters Stock: When Legal Intelligence Becomes Mission-Critical Infrastructure
Popular Narratives


Crazy Undervalued 42 Baggers Silver Play (Active & Running Mine)


NVDA: Expanding AI Demand Will Drive Major Data Center Investments Through 2026

The AI Infrastructure Giant Grows Into Its Valuation
Trending Discussion

