
Advertisement
- Canada
- /
- Trade Distributors
- /
- TSX:FTT
Has Finning International Inc. (TSE:FTT) Been Employing Capital Shrewdly?

Today we are going to look at Finning International Inc. (TSE:FTT) to see whether it might be an attractive investment prospect. To be precise, we'll consider its Return On Capital Employed (ROCE), as that will inform our view of the quality of the business.
First of all, we'll work out how to calculate ROCE. Next, we'll compare it to others in its industry. And finally, we'll look at how its current liabilities are impacting its ROCE.
Understanding Return On Capital Employed (ROCE)
ROCE is a metric for evaluating how much pre-tax income (in percentage terms) a company earns on the capital invested in its business. All else being equal, a better business will have a higher ROCE. Overall, it is a valuable metric that has its flaws. Renowned investment researcher Michael Mauboussin has suggested that a high ROCE can indicate that 'one dollar invested in the company generates value of more than one dollar'.
So, How Do We Calculate ROCE?
The formula for calculating the return on capital employed is:
Return on Capital Employed = Earnings Before Interest and Tax (EBIT) ÷ (Total Assets - Current Liabilities)
Or for Finning International:
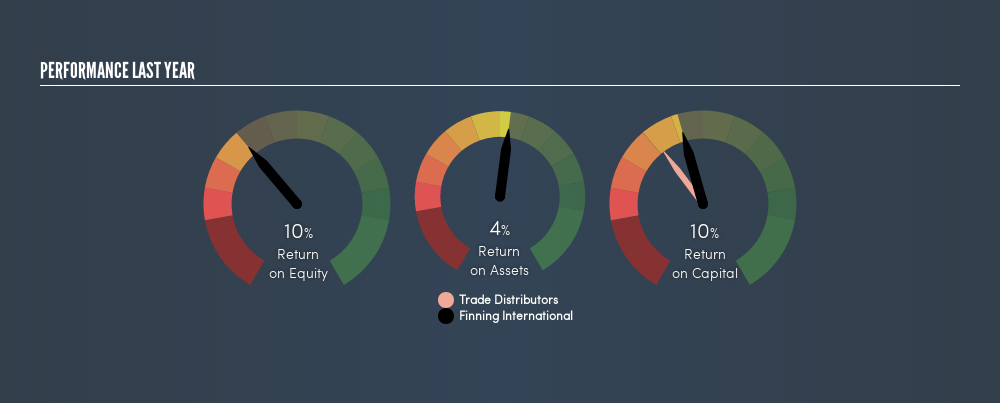
0.10 = CA$393m ÷ (CA$6.5b - CA$2.6b) (Based on the trailing twelve months to June 2019.)
So, Finning International has an ROCE of 10%.
See our latest analysis for Finning International
Does Finning International Have A Good ROCE?
ROCE is commonly used for comparing the performance of similar businesses. It appears that Finning International's ROCE is fairly close to the Trade Distributors industry average of 12%. Separate from Finning International's performance relative to its industry, its ROCE in absolute terms looks satisfactory, and it may be worth researching in more depth.
We can see that , Finning International currently has an ROCE of 10% compared to its ROCE 3 years ago, which was 7.6%. This makes us think about whether the company has been reinvesting shrewdly.
When considering this metric, keep in mind that it is backwards looking, and not necessarily predictive. Companies in cyclical industries can be difficult to understand using ROCE, as returns typically look high during boom times, and low during busts. ROCE is, after all, simply a snap shot of a single year. Since the future is so important for investors, you should check out our free report on analyst forecasts for Finning International.
Do Finning International's Current Liabilities Skew Its ROCE?
Short term (or current) liabilities, are things like supplier invoices, overdrafts, or tax bills that need to be paid within 12 months. Due to the way the ROCE equation works, having large bills due in the near term can make it look as though a company has less capital employed, and thus a higher ROCE than usual. To counter this, investors can check if a company has high current liabilities relative to total assets.
Finning International has total liabilities of CA$2.6b and total assets of CA$6.5b. Therefore its current liabilities are equivalent to approximately 40% of its total assets. With this level of current liabilities, Finning International's ROCE is boosted somewhat.
What We Can Learn From Finning International's ROCE
With a decent ROCE, the company could be interesting, but remember that the level of current liabilities make the ROCE look better. Finning International shapes up well under this analysis, but it is far from the only business delivering excellent numbers . You might also want to check this free collection of companies delivering excellent earnings growth.
If you are like me, then you will not want to miss this free list of growing companies that insiders are buying.
We aim to bring you long-term focused research analysis driven by fundamental data. Note that our analysis may not factor in the latest price-sensitive company announcements or qualitative material.
If you spot an error that warrants correction, please contact the editor at editorial-team@simplywallst.com. This article by Simply Wall St is general in nature. It does not constitute a recommendation to buy or sell any stock, and does not take account of your objectives, or your financial situation. Simply Wall St has no position in the stocks mentioned. Thank you for reading.
About TSX:FTT
Finning International
Sells, services, and rents heavy equipment, engines, and related products in Canada, Chile, the United Kingdom, Argentina, and internationally.
Established dividend payer and good value.
Similar Companies
Market Insights

Advertisement
Community Narratives
Vita Life Sciences Set for a 12.72% Revenue Growth While Tackling Operational Challenges
Fair Value AU$2.42|8.7% undervalued
RO
Community Contributor
Vossloh rides a €500 billion wave to boost growth and earnings in the next decade
Fair Value €78.41|6.3% undervalued
CH
Community Contributor
Intuitive Surgical Will Transform Healthcare with 12% Revenue Growth
Fair Value US$325.55|56.5% overvalued
UN
Community Contributor