Advertisement
- Canada
- /
- Oil and Gas
- /
- TSX:MGA
Forsys Metals And 2 Other TSX Penny Stocks To Watch

Simply Wall St
Reviewed by Simply Wall St
The Canadian market is currently navigating significant developments, such as potential changes to U.S. withholding tax rates on dividends and rising bond yields, which are influencing investor sentiment and financial strategies. In this context, penny stocks—though an older term—remain relevant for those interested in smaller or less-established companies that may offer value opportunities. By focusing on firms with strong fundamentals and clear growth potential, investors can explore these stocks as possible avenues for both stability and upside in a shifting economic landscape.
Top 10 Penny Stocks In Canada
| Name | Share Price | Market Cap | Rewards & Risks |
| Westbridge Renewable Energy (TSXV:WEB) | CA$0.74 | CA$75.86M | ✅ 3 ⚠️ 3 View Analysis > |
| NTG Clarity Networks (TSXV:NCI) | CA$2.95 | CA$114.25M | ✅ 4 ⚠️ 2 View Analysis > |
| Intermap Technologies (TSX:IMP) | CA$2.33 | CA$134.95M | ✅ 3 ⚠️ 2 View Analysis > |
| Thor Explorations (TSXV:THX) | CA$0.73 | CA$445.75M | ✅ 3 ⚠️ 2 View Analysis > |
| Orezone Gold (TSX:ORE) | CA$1.20 | CA$636.86M | ✅ 4 ⚠️ 2 View Analysis > |
| McChip Resources (TSXV:MCS) | CA$0.80 | CA$4.4M | ✅ 2 ⚠️ 5 View Analysis > |
| Hemisphere Energy (TSXV:HME) | CA$1.74 | CA$168.16M | ✅ 3 ⚠️ 1 View Analysis > |
| PetroTal (TSX:TAL) | CA$0.61 | CA$548.99M | ✅ 3 ⚠️ 3 View Analysis > |
| Pulse Seismic (TSX:PSD) | CA$2.60 | CA$132.47M | ✅ 1 ⚠️ 2 View Analysis > |
| Findev (TSXV:FDI) | CA$0.44 | CA$12.6M | ✅ 2 ⚠️ 3 View Analysis > |
Click here to see the full list of 905 stocks from our TSX Penny Stocks screener.
Let's take a closer look at a couple of our picks from the screened companies.
Forsys Metals (TSX:FSY)
Simply Wall St Financial Health Rating: ★★★★☆☆
Overview: Forsys Metals Corp., with a market cap of CA$109.55 million, is involved in the acquisition, exploration, and development of uranium mineral properties in Africa.
Operations: Forsys Metals Corp. does not report any revenue segments.
Market Cap: CA$109.55M
Forsys Metals Corp., with a market cap of CA$109.55 million, remains pre-revenue and unprofitable but has shown some financial stability by maintaining no debt and covering its short-term liabilities with current assets. Recent developments include ore-sorting testwork at the Norasa Uranium project, which could enhance processing efficiency and reduce costs. The company reported a reduced net loss for Q1 2025 compared to the previous year, indicating some improvement in financial performance. Additionally, Forsys raised CA$2.84 million through private placements to potentially support ongoing projects and operations despite having less than a year of cash runway.
- Navigate through the intricacies of Forsys Metals with our comprehensive balance sheet health report here.
- Evaluate Forsys Metals' historical performance by accessing our past performance report.
Mega Uranium (TSX:MGA)
Simply Wall St Financial Health Rating: ★★★★★☆
Overview: Mega Uranium Ltd. is a uranium mining and investment company focused on exploring uranium properties mainly in Canada and Australia, with a market cap of CA$104.99 million.
Operations: Mega Uranium Ltd. does not report distinct revenue segments.
Market Cap: CA$105M
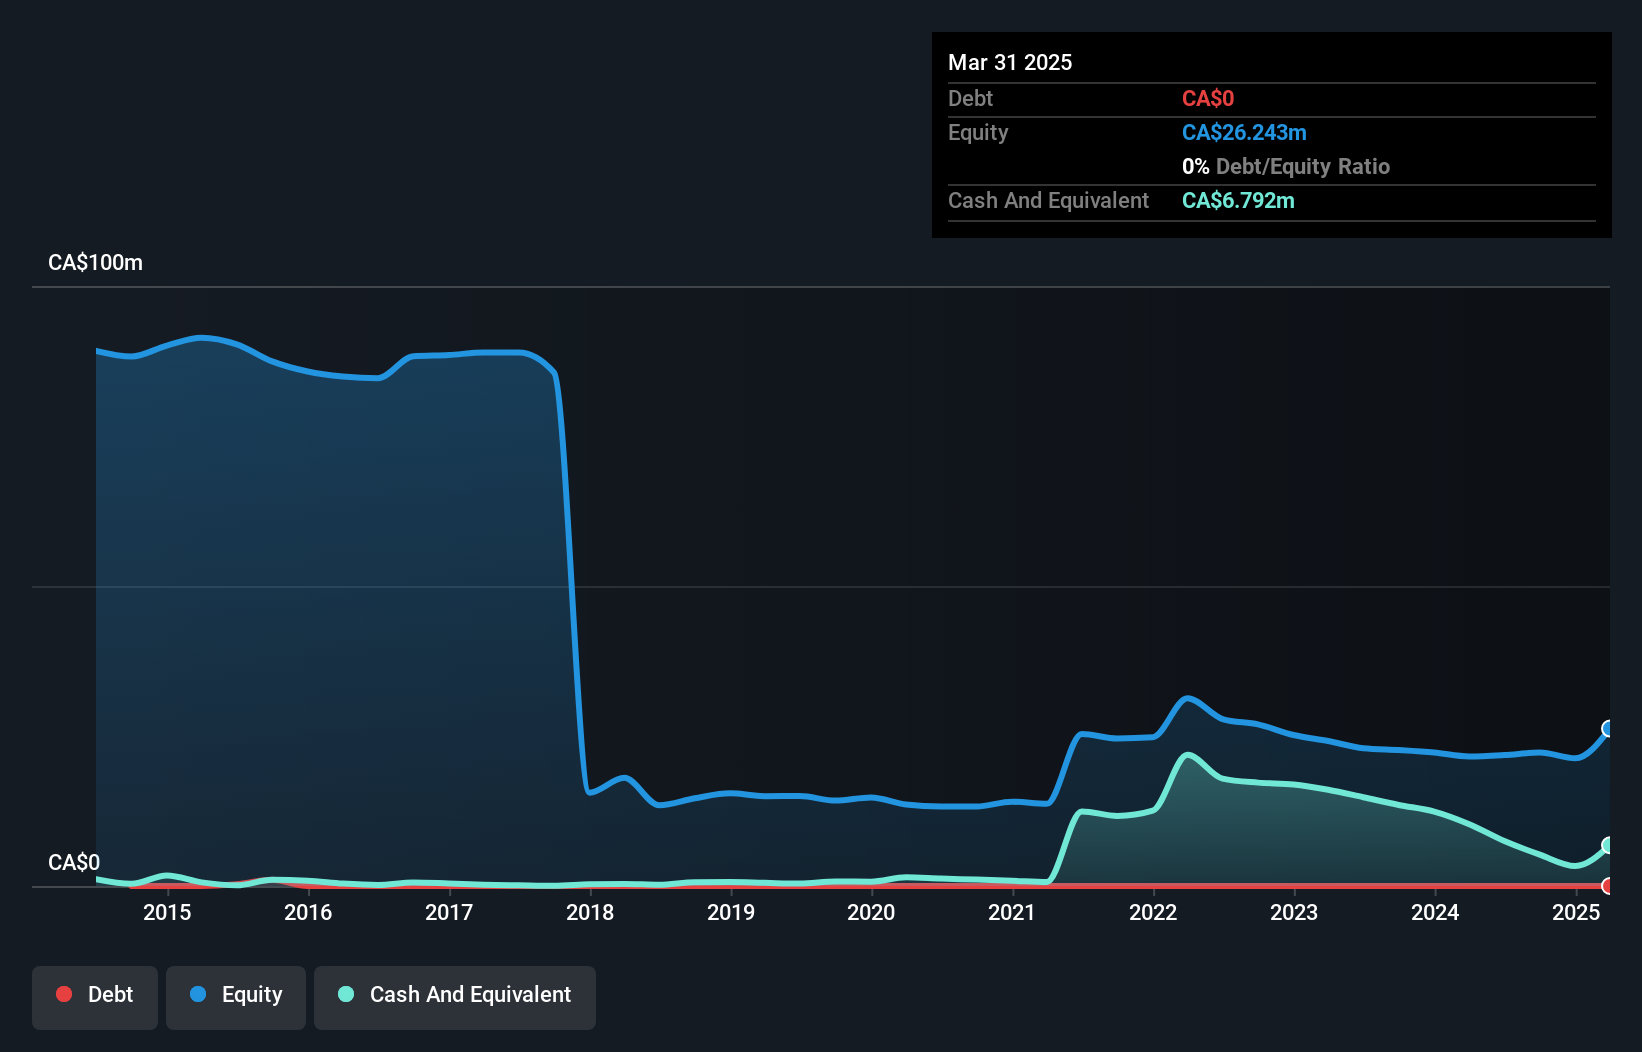
Mega Uranium Ltd., with a market cap of CA$104.99 million, is pre-revenue and unprofitable, experiencing increased losses over the past five years. Despite this, it maintains financial stability through short-term assets exceeding liabilities and a positive cash runway for over three years. The company's debt to equity ratio has risen to 12.3%, yet it holds more cash than total debt. Recent earnings results revealed a net loss of CA$9.6 million for Q2 2025, marking a significant decline from the previous year's profit, indicating ongoing challenges in achieving profitability amidst its exploratory focus.
- Take a closer look at Mega Uranium's potential here in our financial health report.
- Gain insights into Mega Uranium's past trends and performance with our report on the company's historical track record.
EMX Royalty (TSXV:EMX)
Simply Wall St Financial Health Rating: ★★★★☆☆
Overview: EMX Royalty Corporation explores for and generates royalties from metals and minerals properties, with a market cap of CA$338.02 million.
Operations: The company derives its revenue of $29.63 million from activities related to acquiring, managing, and generating royalties.
Market Cap: CA$338.02M
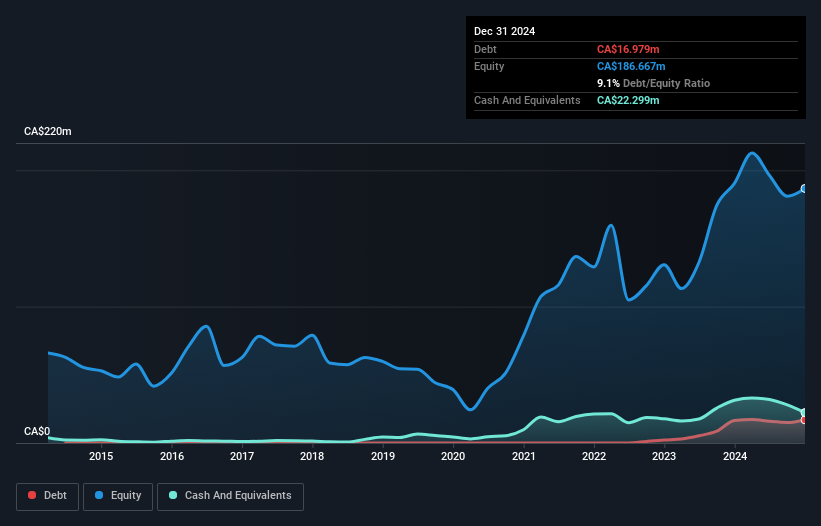
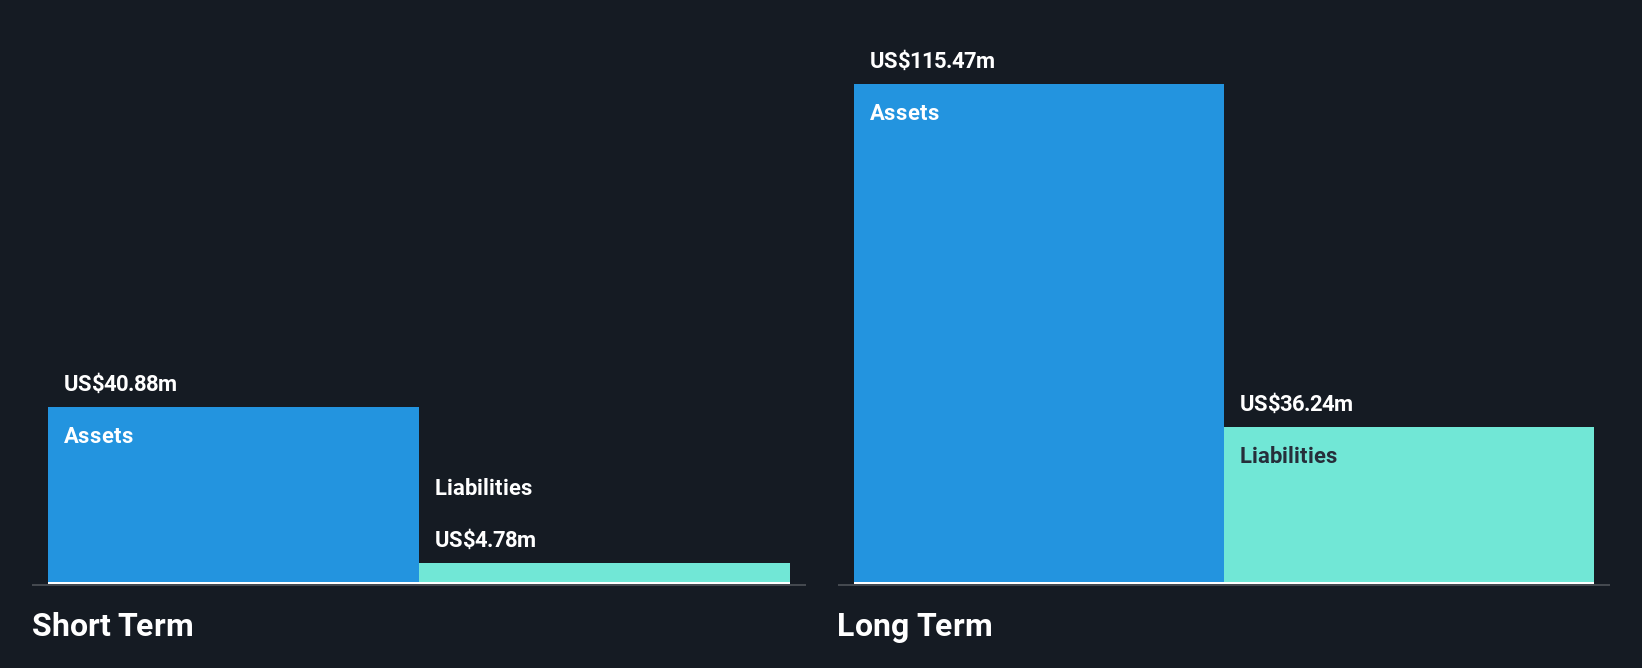
EMX Royalty Corporation, with a market cap of CA$338.02 million, has shown improved financial performance, reporting a net income of US$1.26 million for Q1 2025 compared to a loss the previous year. The company's revenue reached US$8.42 million for the quarter, reflecting growth from its royalty-based business model. Despite increased debt levels over five years, EMX maintains satisfactory debt management with short-term assets exceeding liabilities and operating cash flow covering 20.5% of its debt. However, interest coverage remains low at 0.9x EBIT, suggesting potential challenges in managing interest obligations despite recent profitability improvements.
- Dive into the specifics of EMX Royalty here with our thorough balance sheet health report.
- Understand EMX Royalty's earnings outlook by examining our growth report.
Where To Now?
- Discover the full array of 905 TSX Penny Stocks right here.
- Ready To Venture Into Other Investment Styles? Trump has pledged to "unleash" American oil and gas and these 22 US stocks have developments that are poised to benefit.
This article by Simply Wall St is general in nature. We provide commentary based on historical data and analyst forecasts only using an unbiased methodology and our articles are not intended to be financial advice. It does not constitute a recommendation to buy or sell any stock, and does not take account of your objectives, or your financial situation. We aim to bring you long-term focused analysis driven by fundamental data. Note that our analysis may not factor in the latest price-sensitive company announcements or qualitative material. Simply Wall St has no position in any stocks mentioned.
New: Manage All Your Stock Portfolios in One Place
We've created the ultimate portfolio companion for stock investors, and it's free.
• Connect an unlimited number of Portfolios and see your total in one currency
• Be alerted to new Warning Signs or Risks via email or mobile
• Track the Fair Value of your stocks
Have feedback on this article? Concerned about the content? Get in touch with us directly. Alternatively, email editorial-team@simplywallst.com
About TSX:MGA
Mega Uranium
A uranium mining and investment company, explores for uranium properties primarily in Canada and Australia.
Adequate balance sheet and slightly overvalued.
Similar Companies
Market Insights

Advertisement
Community Narratives
A formidable player in AI and enterprise computing.
Fair Value US$210.00|2.3% overvalued
CO
Community Contributor
IREN's Bold Moves in Sustainable Bitcoin Mining & AI Data Centers
Fair Value US$72.52|17.6% undervalued
BL
Community Contributor
Cooling the Champions: The Aussie Tech Behind F1's Victories
Fair Value AU$12.40|40.4% undervalued
TR
Community Contributor