
Advertisement

As the pan-European STOXX Europe 600 Index rose by 0.90%, buoyed by slowing inflation and an easing in European Central Bank monetary policy, investors are increasingly looking to dividend stocks as a potential stabilizing force in their portfolios. In this environment, selecting dividend stocks with strong fundamentals and consistent payout histories can be a prudent strategy for those seeking to enhance portfolio resilience amidst economic fluctuations.
Top 10 Dividend Stocks In Europe
| Name | Dividend Yield | Dividend Rating |
| Zurich Insurance Group (SWX:ZURN) | 4.46% | ★★★★★★ |
| St. Galler Kantonalbank (SWX:SGKN) | 3.97% | ★★★★★★ |
| Rubis (ENXTPA:RUI) | 6.91% | ★★★★★★ |
| Les Docks des Pétroles d'Ambès -SA (ENXTPA:DPAM) | 5.60% | ★★★★★★ |
| Julius Bär Gruppe (SWX:BAER) | 4.86% | ★★★★★★ |
| HEXPOL (OM:HPOL B) | 4.79% | ★★★★★★ |
| Cembra Money Bank (SWX:CMBN) | 4.33% | ★★★★★★ |
| Bredband2 i Skandinavien (OM:BRE2) | 4.17% | ★★★★★★ |
| Banque Cantonale Vaudoise (SWX:BCVN) | 4.86% | ★★★★★★ |
| Allianz (XTRA:ALV) | 4.49% | ★★★★★★ |
Click here to see the full list of 231 stocks from our Top European Dividend Stocks screener.
Here's a peek at a few of the choices from the screener.
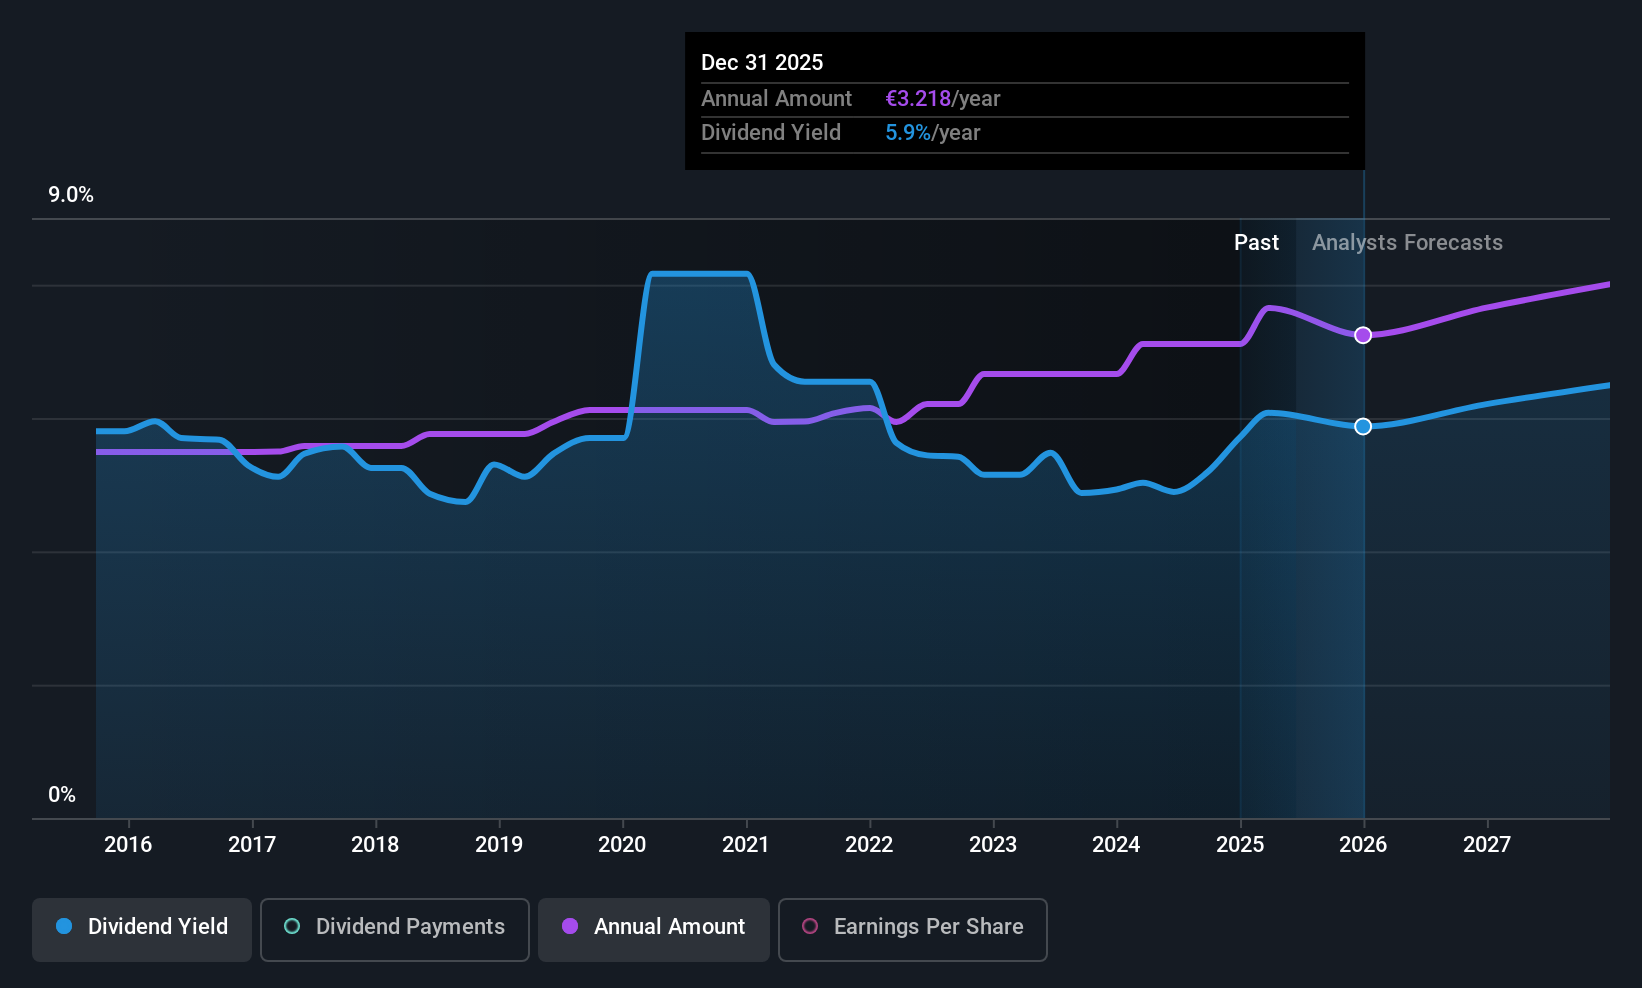
TotalEnergies (ENXTPA:TTE)
Simply Wall St Dividend Rating: ★★★★★☆
Overview: TotalEnergies SE is a multi-energy company involved in the production and marketing of oil, biofuels, natural gas, biogas, low-carbon hydrogen, renewables, and electricity across France, Europe, and globally with a market cap of €121.24 billion.
Operations: TotalEnergies SE's revenue is primarily derived from its Refining & Chemicals segment ($121.03 billion), Marketing & Services segment ($64.20 billion), Exploration & Production segment ($43.44 billion), Integrated Power segment ($23.25 billion), and Integrated LNG segment ($20.66 billion).
Dividend Yield: 5.9%
TotalEnergies offers a dividend yield in the top 25% of French market payers, supported by earnings and cash flow coverage with payout ratios around 55.7% and 53.8%, respectively. Though dividends have grown over the past decade, they have been volatile, with occasional drops exceeding 20%. Recent strategic alliances in AI and renewable energy projects reflect TotalEnergies' commitment to sustainable growth, potentially influencing future dividend stability despite historical volatility.
- Delve into the full analysis dividend report here for a deeper understanding of TotalEnergies.
- In light of our recent valuation report, it seems possible that TotalEnergies is trading behind its estimated value.
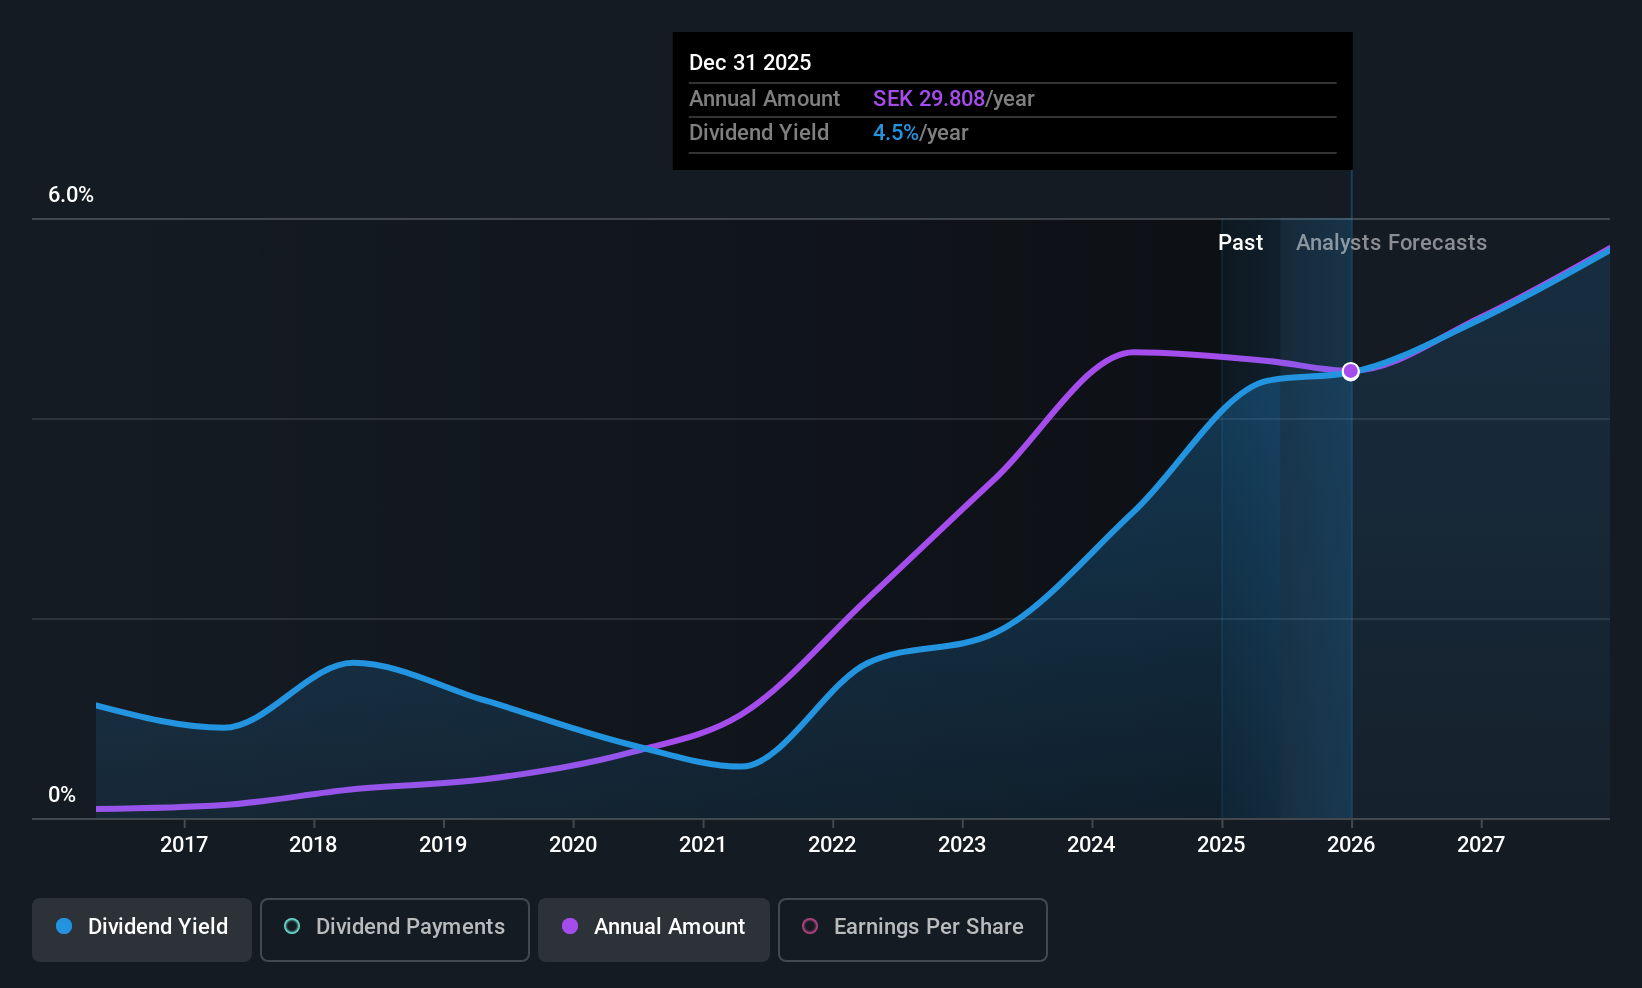
Evolution (OM:EVO)
Simply Wall St Dividend Rating: ★★★★☆☆
Overview: Evolution AB (publ) develops, produces, markets, and licenses online casino systems to gaming operators worldwide and has a market cap of approximately SEK137.83 billion.
Operations: Evolution AB (publ) generates revenue of €2.23 billion from providing solutions for live casino and associated services to gaming operators globally.
Dividend Yield: 4.5%
Evolution's dividend yield ranks in the top 25% of Swedish market payers, supported by a low payout ratio of 47.4%, ensuring coverage by both earnings and cash flow. Despite being a relatively new dividend payer with less than a decade of payments, dividends have been stable and growing. Recent strategic actions include share buybacks worth up to €346 million, aimed at optimizing capital structure and potentially enhancing shareholder value alongside its ongoing partnerships like the one with Caesars Entertainment.
- Get an in-depth perspective on Evolution's performance by reading our dividend report here.
- Our comprehensive valuation report raises the possibility that Evolution is priced lower than what may be justified by its financials.
NOTE (OM:NOTE)
Simply Wall St Dividend Rating: ★★★★★☆
Overview: NOTE AB (publ) is a company that offers electronics manufacturing services across Sweden, Finland, the United Kingdom, Bulgaria, Estonia, China, and internationally with a market cap of SEK4.62 billion.
Operations: NOTE AB (publ) generates revenue from electronics manufacturing services primarily in Western Europe with SEK2.99 billion and the Rest of World segment contributing SEK905 million.
Dividend Yield: 4.3%
NOTE AB offers a dividend yield in the top 25% of Swedish market payers, with a payout ratio of 80.7%, indicating coverage by earnings and cash flow due to a low cash payout ratio of 29.1%. Despite past volatility, dividends have grown over the last decade. Recent earnings showed stable net income at SEK 65 million for Q1 2025, and sales guidance for Q2 remains robust between SEK 950-1,050 million.
- Take a closer look at NOTE's potential here in our dividend report.
- According our valuation report, there's an indication that NOTE's share price might be on the cheaper side.

Seize The Opportunity
- Discover the full array of 231 Top European Dividend Stocks right here.
- Got skin in the game with these stocks? Elevate how you manage them by using Simply Wall St's portfolio, where intuitive tools await to help optimize your investment outcomes.
- Maximize your investment potential with Simply Wall St, the comprehensive app that offers global market insights for free.
Searching for a Fresh Perspective?
- Explore high-performing small cap companies that haven't yet garnered significant analyst attention.
- Fuel your portfolio with companies showing strong growth potential, backed by optimistic outlooks both from analysts and management.
- Find companies with promising cash flow potential yet trading below their fair value.
This article by Simply Wall St is general in nature. We provide commentary based on historical data and analyst forecasts only using an unbiased methodology and our articles are not intended to be financial advice. It does not constitute a recommendation to buy or sell any stock, and does not take account of your objectives, or your financial situation. We aim to bring you long-term focused analysis driven by fundamental data. Note that our analysis may not factor in the latest price-sensitive company announcements or qualitative material. Simply Wall St has no position in any stocks mentioned.
Valuation is complex, but we're here to simplify it.
Discover if NOTE might be undervalued or overvalued with our detailed analysis, featuring fair value estimates, potential risks, dividends, insider trades, and its financial condition.
Access Free AnalysisHave feedback on this article? Concerned about the content? Get in touch with us directly. Alternatively, email editorial-team@simplywallst.com
About OM:NOTE
NOTE
Provides electronics manufacturing services in Sweden, Finland, the United Kingdom, Bulgaria, Estonia, China, and internationally.
Flawless balance sheet established dividend payer.
Similar Companies
Market Insights

Advertisement
Community Narratives
The Future of Drug Testing? Fingerprint Tech Shows Serious Promise
Fair Value US$2.98|36.2% undervalued
JO
Community Contributor
Occidental Petroleum is set to achieve a 16% profit margin improvement
Fair Value US$55.05|18.7% undervalued
DZ
Community Contributor
Argan's Revenue Set to Soar with a 13.31% Growth in the Coming Decade
Fair Value US$284.68|22.0% undervalued
KE
Community Contributor
EU#1 - From German Startup to EU’s Biggest Company
Fair Value €248.62|5.0% overvalued
TO
Community Contributor