Advertisement
- United Kingdom
- /
- IT
- /
- AIM:RCN
Estimating The Intrinsic Value Of Redcentric plc (LON:RCN)
How far off is Redcentric plc (LON:RCN) from its intrinsic value? Using the most recent financial data, we'll take a look at whether the stock is fairly priced by taking the foreast future cash flows of the company and discounting them back to today's value. This is done using the Discounted Cash Flow (DCF) model. It may sound complicated, but actually it is quite simple!
Remember though, that there are many ways to estimate a company's value, and a DCF is just one method. If you want to learn more about discounted cash flow, the rationale behind this calculation can be read in detail in the Simply Wall St analysis model.
See our latest analysis for Redcentric
What's the estimated valuation?
We're using the 2-stage growth model, which simply means we take in account two stages of company's growth. In the initial period the company may have a higher growth rate and the second stage is usually assumed to have a stable growth rate. To begin with, we have to get estimates of the next ten years of cash flows. Where possible we use analyst estimates, but when these aren't available we extrapolate the previous free cash flow (FCF) from the last estimate or reported value. We assume companies with shrinking free cash flow will slow their rate of shrinkage, and that companies with growing free cash flow will see their growth rate slow, over this period. We do this to reflect that growth tends to slow more in the early years than it does in later years.
Generally we assume that a dollar today is more valuable than a dollar in the future, and so the sum of these future cash flows is then discounted to today's value:
10-year free cash flow (FCF) forecast
| 2020 | 2021 | 2022 | 2023 | 2024 | 2025 | 2026 | 2027 | 2028 | 2029 | |
| Levered FCF (£, Millions) | UK£10.4m | UK£14.1m | UK£14.8m | UK£15.3m | UK£15.7m | UK£16.1m | UK£16.4m | UK£16.7m | UK£17.0m | UK£17.3m |
| Growth Rate Estimate Source | Analyst x1 | Analyst x1 | Est @ 4.65% | Est @ 3.62% | Est @ 2.9% | Est @ 2.4% | Est @ 2.04% | Est @ 1.8% | Est @ 1.62% | Est @ 1.5% |
| Present Value (£, Millions) Discounted @ 9.0% | UK£9.5 | UK£11.9 | UK£11.4 | UK£10.8 | UK£10.2 | UK£9.6 | UK£9.0 | UK£8.4 | UK£7.8 | UK£7.3 |
("Est" = FCF growth rate estimated by Simply Wall St)
Present Value of 10-year Cash Flow (PVCF) = UK£95m
The second stage is also known as Terminal Value, this is the business's cash flow after the first stage. The Gordon Growth formula is used to calculate Terminal Value at a future annual growth rate equal to the 10-year government bond rate of 1.2%. We discount the terminal cash flows to today's value at a cost of equity of 9.0%.
Terminal Value (TV)= FCF2029 × (1 + g) ÷ (r – g) = UK£17m× (1 + 1.2%) ÷ 9.0%– 1.2%) = UK£224m
Present Value of Terminal Value (PVTV)= TV / (1 + r)10= UK£224m÷ ( 1 + 9.0%)10= UK£94m
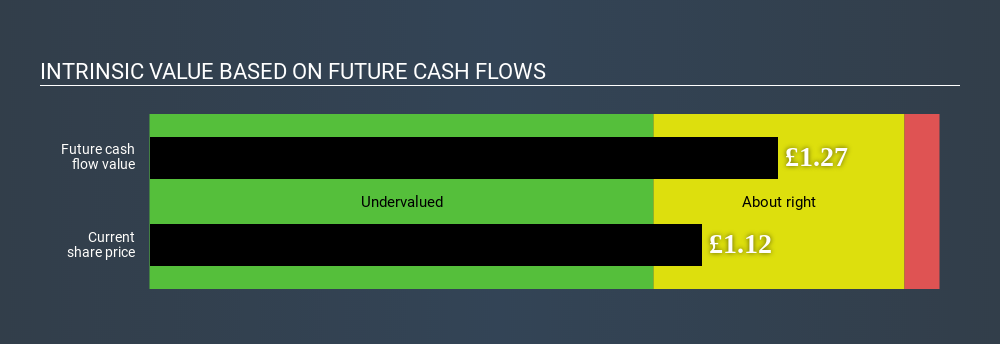
The total value, or equity value, is then the sum of the present value of the future cash flows, which in this case is UK£189m. The last step is to then divide the equity value by the number of shares outstanding. Relative to the current share price of UK£1.1, the company appears about fair value at a 12% discount to where the stock price trades currently. Remember though, that this is just an approximate valuation, and like any complex formula - garbage in, garbage out.
Important assumptions
We would point out that the most important inputs to a discounted cash flow are the discount rate and of course the actual cash flows. You don't have to agree with these inputs, I recommend redoing the calculations yourself and playing with them. The DCF also does not consider the possible cyclicality of an industry, or a company's future capital requirements, so it does not give a full picture of a company's potential performance. Given that we are looking at Redcentric as potential shareholders, the cost of equity is used as the discount rate, rather than the cost of capital (or weighted average cost of capital, WACC) which accounts for debt. In this calculation we've used 9.0%, which is based on a levered beta of 1.128. Beta is a measure of a stock's volatility, compared to the market as a whole. We get our beta from the industry average beta of globally comparable companies, with an imposed limit between 0.8 and 2.0, which is a reasonable range for a stable business.
Next Steps:
Valuation is only one side of the coin in terms of building your investment thesis, and it shouldn’t be the only metric you look at when researching a company. The DCF model is not a perfect stock valuation tool. Rather it should be seen as a guide to "what assumptions need to be true for this stock to be under/overvalued?" If a company grows at a different rate, or if its cost of equity or risk free rate changes sharply, the output can look very different. For Redcentric, We've put together three further aspects you should look at:
- Financial Health: Does RCN have a healthy balance sheet? Take a look at our free balance sheet analysis with six simple checks on key factors like leverage and risk.
- Future Earnings: How does RCN's growth rate compare to its peers and the wider market? Dig deeper into the analyst consensus number for the upcoming years by interacting with our free analyst growth expectation chart.
- Other High Quality Alternatives: Do you like a good all-rounder? Explore our interactive list of high quality stocks to get an idea of what else is out there you may be missing!
PS. The Simply Wall St app conducts a discounted cash flow valuation for every stock on the AIM every day. If you want to find the calculation for other stocks just search here.
Love or hate this article? Concerned about the content? Get in touch with us directly. Alternatively, email editorial-team@simplywallst.com.
This article by Simply Wall St is general in nature. It does not constitute a recommendation to buy or sell any stock, and does not take account of your objectives, or your financial situation. We aim to bring you long-term focused analysis driven by fundamental data. Note that our analysis may not factor in the latest price-sensitive company announcements or qualitative material. Simply Wall St has no position in any stocks mentioned. Thank you for reading.
About AIM:RCN
Redcentric
Provides IT managed services for public sector and commercial markets in the United Kingdom.
Slight risk with moderate growth potential.
Market Insights

Advertisement
Weekly Picks
DA


davidlsander on Nevgold ·
The U.S. Government Is Desperate for This Metal. This Tiny Miner Has It -- Its Closest Peer Is Already Worth Double.
Fair Value:US$2.1947.9% undervalued
45 followersusers have followed this narrative
0 commentsusers have commented on this narrative
4 likesusers have liked this narrative
WE


WealthAP on Novo Nordisk ·
Novo Nordisk (NVO): Is the "Easy Growth" Story Over?
Fair Value:DKK 407.7719.6% undervalued
24 followersusers have followed this narrative
0 commentsusers have commented on this narrative
1 likeusers have liked this narrative
VA


ValueInvestingSubstack on Zoetis ·
Zoetis down -50% over the past year
Fair Value:US$92.9218.0% undervalued
8 followersusers have followed this narrative
0 commentsusers have commented on this narrative
4 likesusers have liked this narrative
CE


CentryResearch on Centrus Energy ·
Centrus Energy: The Next Nuclear Bottleneck Isn't Reactors. It's Fuel.
Fair Value:US$19017.7% undervalued
1 followerusers have followed this narrative
0 commentsusers have commented on this narrative
2 likesusers have liked this narrative
Recently Updated Narratives
BL


BlackGoat on Micron Technology ·
Micron's New Supercycle: Riding the High-Bandwidth Memory Wave
Fair Value:US$1.48k41.5% undervalued
90 followersusers have followed this narrative
8 commentsusers have commented on this narrative
0 likesusers have liked this narrative
MA


MarkoVT on COVER ·
Significant headwinds will temper expectations for FY2027
Fair Value:JP¥1.91k15.0% undervalued
6 followersusers have followed this narrative
0 commentsusers have commented on this narrative
1 likeusers have liked this narrative
AN


AnimalDoctorKwon on Teladoc Health ·
Pandemic Relic or Cash-Flow Bargain?
Fair Value:US$1535.7% undervalued
1 followerusers have followed this narrative
0 commentsusers have commented on this narrative
0 likesusers have liked this narrative
Popular Narratives
IN


Investingwilly on Mastercard ·
Mastercard: The Best Dividend Stock You're Ignoring
Fair Value:US$75027.0% undervalued
96 followersusers have followed this narrative
1 commentusers have commented on this narrative
9 likesusers have liked this narrative
BL

BlackGoat on Cerebras Systems ·
The Wafer Giant Threatening NVIDIA's GPU Hegemony
Fair Value:US$415.5457.4% undervalued
64 followersusers have followed this narrative
3 commentsusers have commented on this narrative
11 likesusers have liked this narrative
BE

benjamin_lvieq on PayPal Holdings ·
PayPal: PayPal Doesn't Need to Grow – It Needs to Stop Falling – A Mispriced Cash Machine With a Cannibal Buyback
Fair Value:US$6512.6% undervalued
65 followersusers have followed this narrative
2 commentsusers have commented on this narrative
9 likesusers have liked this narrative
Trending Discussion
BE
benjamin_lvieq on PayPal Holdings ·
An investment case is not about loving the product. Its about price vs reality.
2
|0
ST


StoxEurope on Koninklijke Ahold Delhaize ·
I ran Ahold Delhaize through a three-model triangulation — DCF, dividend discount, and residual inco...
1
|0