Stock Analysis
- India
- /
- Hospitality
- /
- NSEI:TAJGVK
Estimating The Fair Value Of TAJGVK Hotels & Resorts Limited (NSE:TAJGVK)


Today we will run through one way of estimating the intrinsic value of TAJGVK Hotels & Resorts Limited (NSE:TAJGVK) by taking the forecast future cash flows of the company and discounting them back to today's value. The Discounted Cash Flow (DCF) model is the tool we will apply to do this. It may sound complicated, but actually it is quite simple!
We would caution that there are many ways of valuing a company and, like the DCF, each technique has advantages and disadvantages in certain scenarios. If you want to learn more about discounted cash flow, the rationale behind this calculation can be read in detail in the Simply Wall St analysis model.
Check out our latest analysis for TAJGVK Hotels & Resorts
Step by step through the calculation
We use what is known as a 2-stage model, which simply means we have two different periods of growth rates for the company's cash flows. Generally the first stage is higher growth, and the second stage is a lower growth phase. To begin with, we have to get estimates of the next ten years of cash flows. Seeing as no analyst estimates of free cash flow are available to us, we have extrapolate the previous free cash flow (FCF) from the company's last reported value. We assume companies with shrinking free cash flow will slow their rate of shrinkage, and that companies with growing free cash flow will see their growth rate slow, over this period. We do this to reflect that growth tends to slow more in the early years than it does in later years.
A DCF is all about the idea that a dollar in the future is less valuable than a dollar today, and so the sum of these future cash flows is then discounted to today's value:
10-year free cash flow (FCF) estimate
| 2021 | 2022 | 2023 | 2024 | 2025 | 2026 | 2027 | 2028 | 2029 | 2030 | |
| Levered FCF (₹, Millions) | ₹738.6m | ₹829.9m | ₹919.7m | ₹1.01b | ₹1.10b | ₹1.19b | ₹1.29b | ₹1.39b | ₹1.49b | ₹1.61b |
| Growth Rate Estimate Source | Est @ 14.59% | Est @ 12.37% | Est @ 10.81% | Est @ 9.73% | Est @ 8.97% | Est @ 8.43% | Est @ 8.06% | Est @ 7.8% | Est @ 7.62% | Est @ 7.49% |
| Present Value (₹, Millions) Discounted @ 18% | ₹627 | ₹598 | ₹562 | ₹523 | ₹484 | ₹445 | ₹408 | ₹374 | ₹341 | ₹311 |
("Est" = FCF growth rate estimated by Simply Wall St)
Present Value of 10-year Cash Flow (PVCF) = ₹4.7b
The second stage is also known as Terminal Value, this is the business's cash flow after the first stage. The Gordon Growth formula is used to calculate Terminal Value at a future annual growth rate equal to the 5-year average of the 10-year government bond yield of 7.2%. We discount the terminal cash flows to today's value at a cost of equity of 18%.
Terminal Value (TV)= FCF2030 × (1 + g) ÷ (r – g) = ₹1.6b× (1 + 7.2%) ÷ (18%– 7.2%) = ₹16b
Present Value of Terminal Value (PVTV)= TV / (1 + r)10= ₹16b÷ ( 1 + 18%)10= ₹3.1b
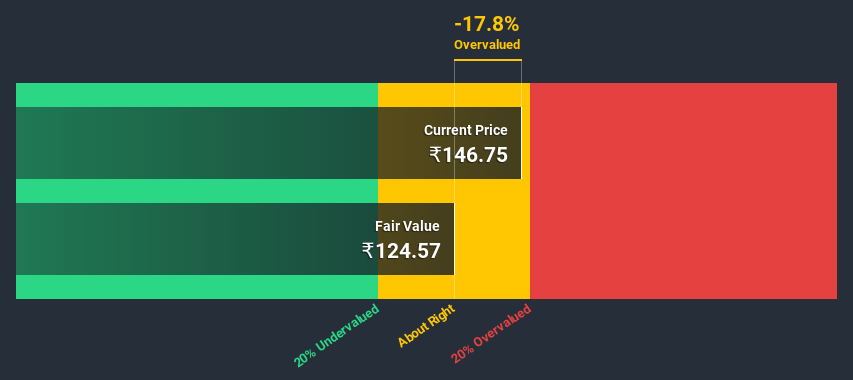
The total value, or equity value, is then the sum of the present value of the future cash flows, which in this case is ₹7.8b. To get the intrinsic value per share, we divide this by the total number of shares outstanding. Relative to the current share price of ₹147, the company appears around fair value at the time of writing. Remember though, that this is just an approximate valuation, and like any complex formula - garbage in, garbage out.
Important assumptions
Now the most important inputs to a discounted cash flow are the discount rate, and of course, the actual cash flows. If you don't agree with these result, have a go at the calculation yourself and play with the assumptions. The DCF also does not consider the possible cyclicality of an industry, or a company's future capital requirements, so it does not give a full picture of a company's potential performance. Given that we are looking at TAJGVK Hotels & Resorts as potential shareholders, the cost of equity is used as the discount rate, rather than the cost of capital (or weighted average cost of capital, WACC) which accounts for debt. In this calculation we've used 18%, which is based on a levered beta of 1.122. Beta is a measure of a stock's volatility, compared to the market as a whole. We get our beta from the industry average beta of globally comparable companies, with an imposed limit between 0.8 and 2.0, which is a reasonable range for a stable business.
Looking Ahead:
Valuation is only one side of the coin in terms of building your investment thesis, and it ideally won't be the sole piece of analysis you scrutinize for a company. The DCF model is not a perfect stock valuation tool. Preferably you'd apply different cases and assumptions and see how they would impact the company's valuation. For instance, if the terminal value growth rate is adjusted slightly, it can dramatically alter the overall result. For TAJGVK Hotels & Resorts, there are three further factors you should explore:
- Risks: As an example, we've found 2 warning signs for TAJGVK Hotels & Resorts (1 doesn't sit too well with us!) that you need to consider before investing here.
- Future Earnings: How does TAJGVK's growth rate compare to its peers and the wider market? Dig deeper into the analyst consensus number for the upcoming years by interacting with our free analyst growth expectation chart.
- Other High Quality Alternatives: Do you like a good all-rounder? Explore our interactive list of high quality stocks to get an idea of what else is out there you may be missing!
PS. Simply Wall St updates its DCF calculation for every Indian stock every day, so if you want to find the intrinsic value of any other stock just search here.
If you decide to trade TAJGVK Hotels & Resorts, use the lowest-cost* platform that is rated #1 Overall by Barron’s, Interactive Brokers. Trade stocks, options, futures, forex, bonds and funds on 135 markets, all from a single integrated account. Promoted
Valuation is complex, but we're helping make it simple.
Find out whether TAJGVK Hotels & Resorts is potentially over or undervalued by checking out our comprehensive analysis, which includes fair value estimates, risks and warnings, dividends, insider transactions and financial health.
View the Free AnalysisThis article by Simply Wall St is general in nature. It does not constitute a recommendation to buy or sell any stock, and does not take account of your objectives, or your financial situation. We aim to bring you long-term focused analysis driven by fundamental data. Note that our analysis may not factor in the latest price-sensitive company announcements or qualitative material. Simply Wall St has no position in any stocks mentioned.
*Interactive Brokers Rated Lowest Cost Broker by StockBrokers.com Annual Online Review 2020
Have feedback on this article? Concerned about the content? Get in touch with us directly. Alternatively, email editorial-team@simplywallst.com.
About NSEI:TAJGVK
TAJGVK Hotels & Resorts
Engages in the business of owning, operating, and managing hotels, palaces, and resorts under the TAJ brand in India.
Flawless balance sheet average dividend payer.
